
Visualize probability distributions
![]()
# Install release version from CRAN
install.packages("vistributions")

# Install development version from GitHub
# install.packages("devtools")
devtools::install_github("rsquaredacademy/vistributions")# visualize normal distribution
vdist_normal_plot()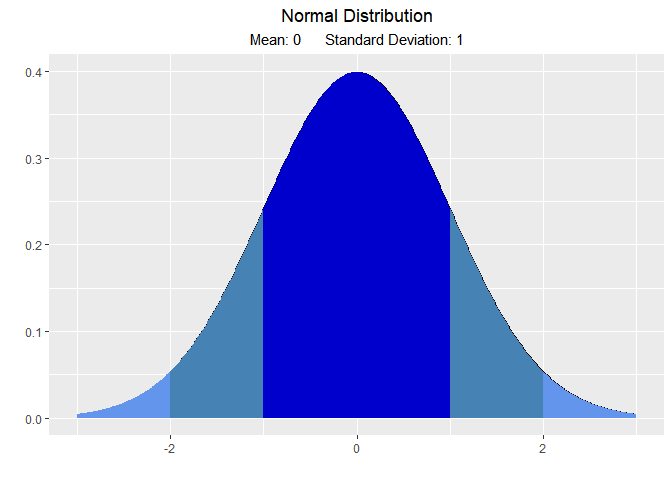
# visualize quantiles out of given probability
vdist_normal_perc(0.95, mean = 2, sd = 1.36, type = 'both')
# visualize probability from a given quantile
vdist_normal_prob(c(-1.74, 1.83), type = 'both')
If you encounter a bug, please file a minimal reproducible example using reprex on github. For questions and clarifications, use StackOverflow.
Need a high-speed mirror for your open-source project?
Contact our mirror admin team at info@clientvps.com.
This archive is provided as a free public service to the community.
Proudly supported by infrastructure from VPSPulse , RxServers , BuyNumber , UnitVPS , OffshoreName and secure payment technology by ArionPay.