The R package visae
implements ‘shiny’ apps to visualize adverse events (AE) based on the
Common Terminology Criteria for Adverse Events (CTCAE).
instal.packages("visae")The latest version can be installed from GitHub as follows:
devtools::install_github("dnzmarcio/visae")patient_id <- 1:4000
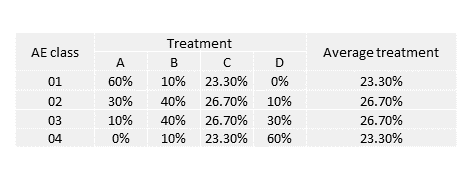
group <- c(rep("A", 1000), rep("B", 1000), rep("C", 1000), rep("D", 1000))
ae_grade <- c(rep("AE class 01", 600), rep("AE class 02", 300),
rep("AE class 03", 100), rep("AE class 04", 0),
rep("AE class 01", 100), rep("AE class 02", 400),
rep("AE class 03", 400), rep("AE class 04", 100),
rep("AE class 01", 233), rep("AE class 02", 267),
rep("AE class 03", 267), rep("AE class 04", 233),
rep("AE class 01", 0), rep("AE class 02", 100),
rep("AE class 03", 300), rep("AE class 04", 600))
dt <- tibble(patient_id = patient_id, trt = group, ae_g = ae_grade)library(visae)
library(magrittr)
library(dplyr)
dt %>% run_ca(., group = trt,
id = patient_id,
ae_grade = ae_g)ca <- dt %>% ca_ae(., group = trt,
id = patient_id,
ae_class = ae_g,
contr_indicator = FALSE,
mass_indicator = TRUE,
contr_threshold = 0,
mass_threshold = 0)
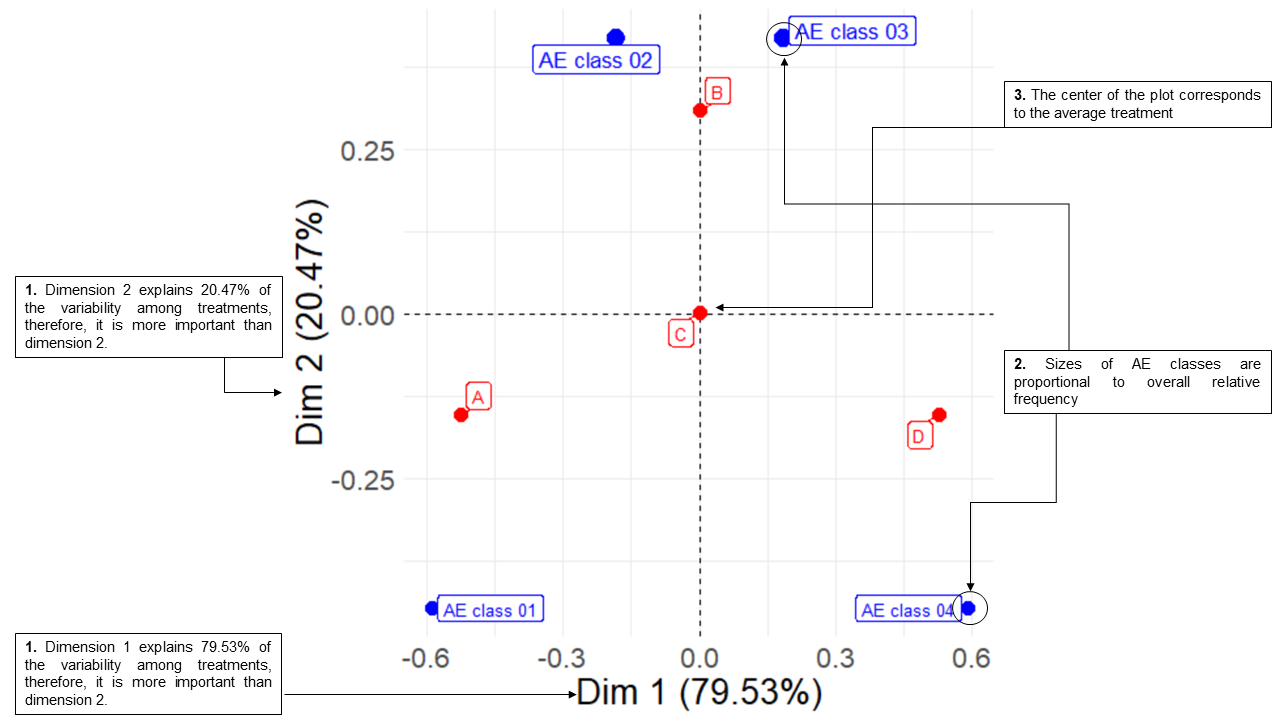
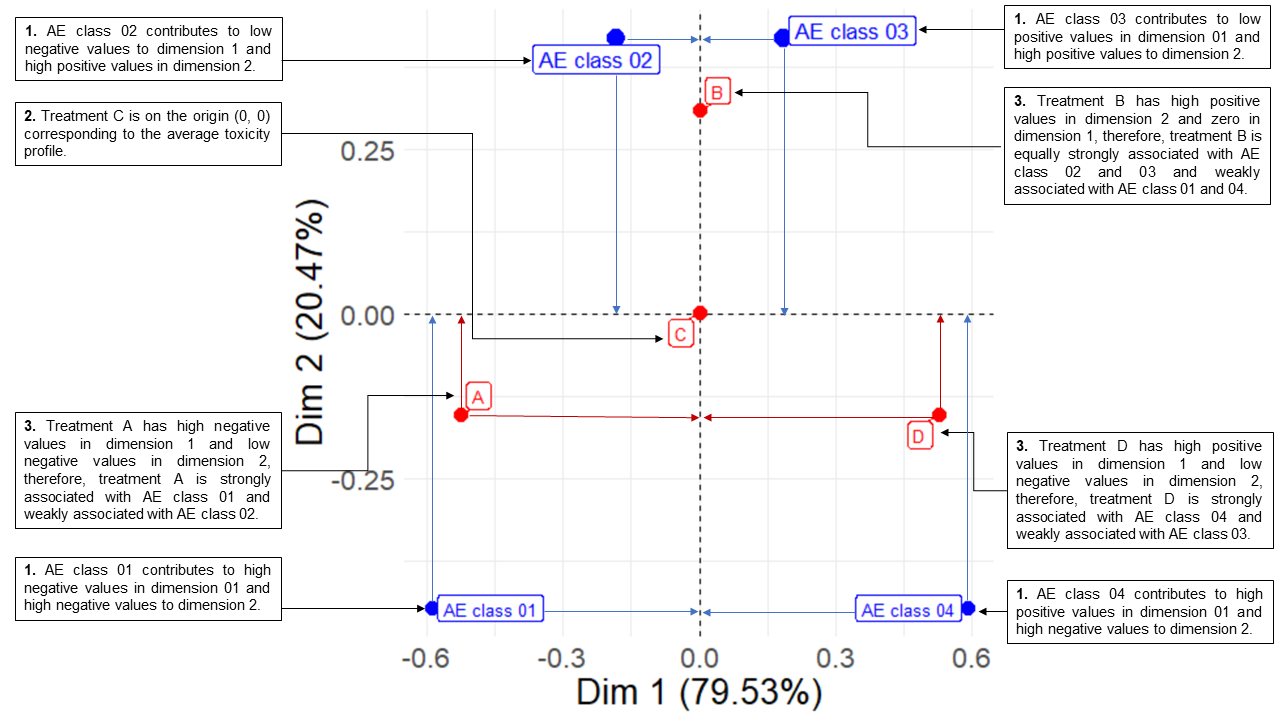
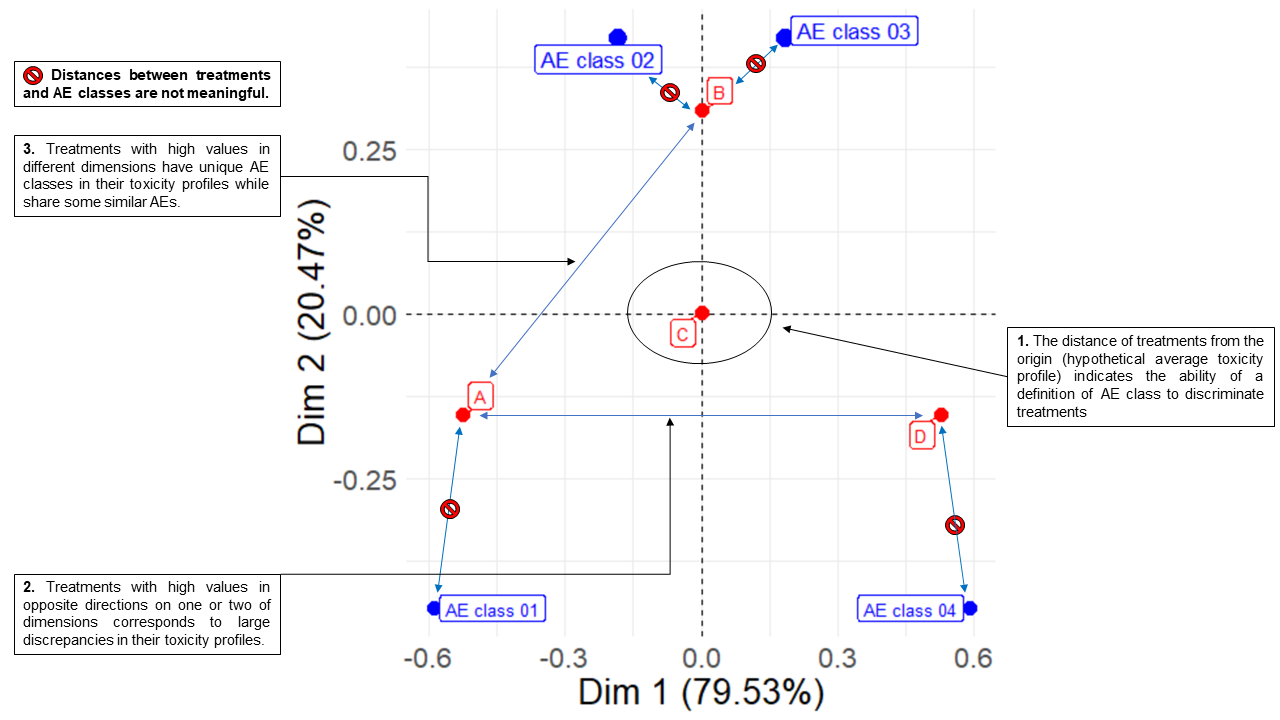
ca$asymmetric_plotInvestigators often interpret CA biplots erroneously assuming that the distance between AE classes dots and treatments dots is an indicative of association. See step by step to interpret biplots correctly are below:
Need a high-speed mirror for your open-source project?
Contact our mirror admin team at info@clientvps.com.
This archive is provided as a free public service to the community.
Proudly supported by infrastructure from VPSPulse , RxServers , BuyNumber , UnitVPS , OffshoreName and secure payment technology by ArionPay.