![]()
![]()
The {trackopt} package tracks parameter values,
gradients, and Hessians at each iteration of numerical optimizers in
R. This can be useful for analyzing optimization progress,
diagnosing issues, and studying convergence behavior.
You can install the released package version from CRAN with:
install.packages("trackopt")The following example tracks nlm while it minimizes Himmelblau’s
function:
library("trackopt")
himmelblau <- function(x) (x[1]^2 + x[2] - 11)^2 + (x[1] + x[2]^2 - 7)^2
track <- nlm_track(f = himmelblau, p = c(0, 0))
summary(track)
#> Iterations: 16
#> Function improvement: 170 -> 1.521e-07
#> Computation time: 0.07373 seconds
#> Initial parameter: 0, 0
#> Final parameter: 3, 2
ggplot2::autoplot(track)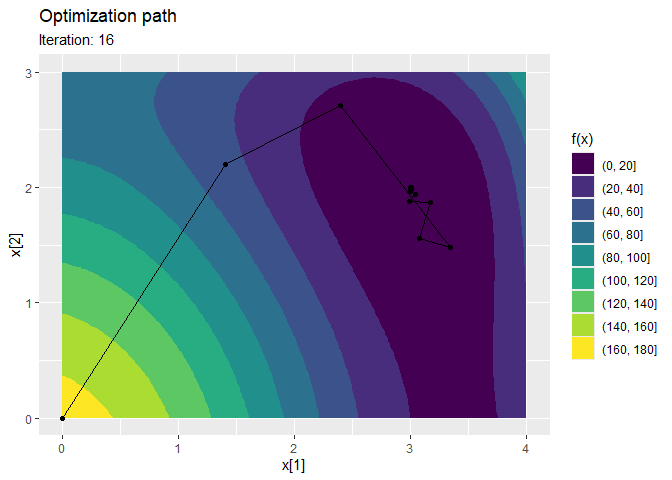
The next example tracks optim while it minimizes a
quartic polynomial:
polynomial <- function(x) 5 * x^4 + 4 * x^3 + x^2 + 3 * x + 2
gradient <- function(x) 20 * x^3 + 12 * x^2 + 2 * x + 3
track <- optim_track(
  f = polynomial,
  p = 0,
  gradient = gradient,
  method = "BFGS"
)
print(track)
#> # A tibble: 9 × 6
#>   iteration value         step parameter hessian seconds
#> *     <dbl> <dbl>        <dbl>     <dbl>   <dbl>   <dbl>
#> 1         0 2      0               0       NA    0
#> 2         1 0.344 -1.66           -0.6      9.20 0.00830
#> 3         2 0.241 -0.103          -0.672   13.0  0.00156
#> 4         3 0.212 -0.0293         -0.712   15.3  0.00144
#> 5         4 0.207 -0.00524        -0.730   16.4  0.00144
#> 6         5 0.206 -0.000679       -0.736   16.8  0.00143
#> 7         6 0.206 -0.0000752      -0.738   17.0  0.00271
#> 8         7 0.206 -0.00000784     -0.739   17.0  0.00151
#> 9         8 0.206 -0.000000802    -0.739   17.0  0.00147
ggplot2::autoplot(track)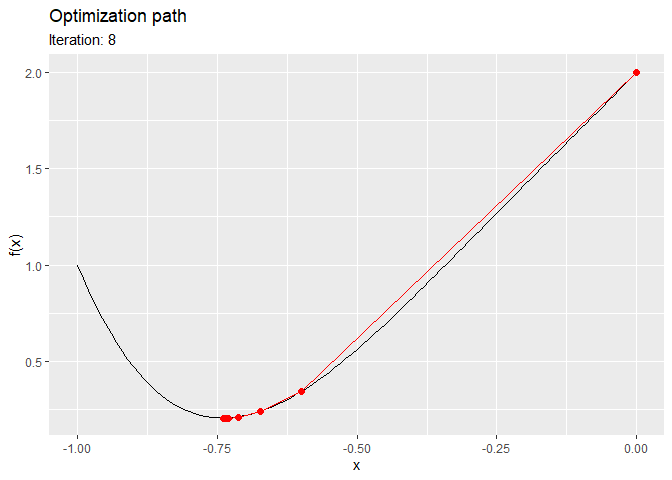
If you have questions, find a bug, or need a feature, please file an issue on GitHub.
Need a high-speed mirror for your open-source project?
Contact our mirror admin team at info@clientvps.com.
This archive is provided as a free public service to the community.
Proudly supported by infrastructure from VPSPulse , RxServers , BuyNumber , UnitVPS , OffshoreName and secure payment technology by ArionPay.