



stability analyses multi-environment trials of plant breeding (the same genotypes in several environments, in randomized complete blocks) to find genotypes that are high-yielding and stable:
indiv_anova(), add_anova(),
er_anova(): analyses of variance in each environment,
combined, and Eberhart and Russell’s;stab_reg(), stab_measures(),
stab_par(), stab_kang(),
stab_fox(): Finlay and Wilkinson’s regression, variance,
ecovalence, Shukla’s stability variance with tests, Kang’s
yield-stability statistic and rank-sum, Fox’s top-third count;stab_eskridge(), stab_reliability(),
stab_superiority(), stab_huehn(): Eskridge’s
safety-first indices, Annicchiarico’s reliability index, Lin and Binns’
superiority measure, Huehn’s nonparametric statistics with tests;ammi(), ammi_biplot(),
stab_asv(), stab_masv(),
stab_dist(): AMMI analysis, biplots and stability values
(the MASV on any number of axes; the AMMI stability distance developed
by the package author);gge_biplot(): the GGE biplot with the which-won-where,
mean-stability and discrimination views, each in genotype-focused,
symmetric or environment-focused scaling;ge_means(), ge_effects(): means, rankings
and interaction effects;stab_interpret(): a plain-language interpretation of
every result, specific to its method and computed from its numbers.The package has been on CRAN since 2018. Version 1.0.0 keeps every function name, argument and result component, corrects several results of the earlier versions (see NEWS), adds plots, methods and the interpretation to every result, adds safety-first, superiority and nonparametric methods, and comes with ten vignettes in HTML and PDF. The companion package StabilityApp runs every analysis in a web browser.
install.packages("stability")
# development version
# install.packages("remotes")
remotes::install_github("myaseen208/stability")library(stability)
fit <-
stab_reg(
.data = ge_data
, .y = Yield
, .rep = Rep
, .gen = Gen
, .env = Env
)
head(fit$StabIndvReg) Gen Mean Slope SE LCI UCI t.b1
1: 013BT034 4247.500 0.9539767 0.2181489 0.4604897 1.447464 -0.21097187
2: 122557 4062.364 1.5159430 0.1702936 1.1307122 1.901174 3.02972727
3: 122559 4258.591 0.9834026 0.3015181 0.3013213 1.665484 -0.05504595
4: 12B.2511 4414.409 1.6375025 0.2843871 0.9941741 2.280831 2.24167144
5: 12FJ26 4057.227 0.7025845 0.2633342 0.1068811 1.298288 -1.12942201
6: 14B.1030 3995.409 0.9951608 0.2598803 0.4072708 1.583051 -0.01862075
p.b1 R.Sqr RMSE SSE Delta p.Delta
1: 0.83760871 0.6799841 323.5306 942048.3 55088.39 2.670478e-02
2: 0.01425298 0.8980107 252.5577 574068.5 14201.74 2.406599e-01
3: 0.95730445 0.5416911 447.1733 1799675.3 150380.28 4.849012e-05
4: 0.05170192 0.7865003 421.7667 1600984.5 128303.52 2.261371e-04
5: 0.28792236 0.4416320 390.5438 1372720.0 102940.80 1.268556e-03
6: 0.98554993 0.6196686 385.4213 1336946.3 98965.95 1.653205e-03stab_interpret(
x = fit
, higher_better = TRUE
, top = 5
)Finlay and Wilkinson's regression on the environment index
Slopes range from 0.09 to 1.71; 2 genotype(s) combine a mean above average
with a slope close to 1 (V14154 and PR119).
Findings:
- Widely adapted (mean above average, slope not different from 1, no
significant deviations): V14154 and PR119.
- Responsive to favourable environments (slope significantly above 1): DN126
and 122557.
- Better in poor environments (slope significantly below 1): BARDC1016.
- The regression explains on average 59% of the variation of a genotype over
environments; below 50% for 17 genotype(s), whose response is poorly
described by a line.
- Significant deviations from regression (unpredictable response): DN126,
V14170, PR115, 12B.2511, FAISALABAD08 and 50 more.
Recommendations:
- Read the slope together with the mean: a slope of 1 is desirable only for a
high-yielding genotype.
- Recommend responsive genotypes for favourable, high-input conditions.
- Recommend genotypes with low slopes where conditions are often poor.
Cautions:
- With few environments the confidence intervals of the slopes are wide.gge_biplot(
.data = ge_data
, .y = Yield
, .rep = Rep
, .gen = Gen
, .env = Env
, .which = "which-won-where"
, .svp = "symmetric"
)Warning: ggrepel: 1 unlabeled data points (too many overlaps). Consider
increasing max.overlaps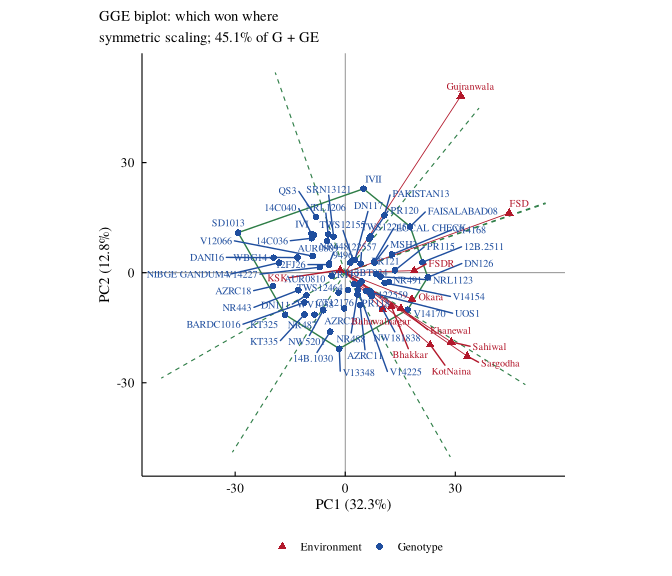
browseVignettes("stability"), starting with
stability_01_getting_started; each is available as HTML and
as PDF.stab_notation()Yaseen M, Eskridge K (2026). _stability: Genotype-by-Environment
Interaction and Yield Stability Analysis_. R package version 1.0.0
(first released 2018), <https://CRAN.R-project.org/package=stability>.BibTeX:
@Manual{stability,
  title = {{stability}: Genotype-by-Environment Interaction and Yield Stability Analysis},
  author = {Muhammad Yaseen and Kent Eskridge},
  year = {2026},
  note = {R package version 1.0.0 (first released 2018)},
  url = {https://CRAN.R-project.org/package=stability},
}