Package website: release | dev
![]()
![]()
![]()
mlr3viz is the visualization package of the mlr3 ecosystem. It features plots for
mlr3 objects such as tasks, learners, predictions, benchmark results,
tuning instances and filters via the autoplot() generic of
ggplot2. The package draws
plots with the viridis color
palette and applies the minimal
theme. Visualizations include barplots, boxplots, histograms, ROC
curves, and Precision-Recall curves.
The gallery
features a showcase post of the plots in
mlr3viz.
Install the last release from CRAN:
install.packages("mlr3viz")Install the development version from GitHub:
# install.packages("pak")
pak::pak("mlr-org/mlr3viz")The gallery
features a showcase post of the visualization functions
mlr3viz.
library(mlr3)
library(mlr3viz)

task = tsk("sonar")
learner = lrn("classif.rpart", predict_type = "prob")
rr = resample(task, learner, rsmp("cv", folds = 3), store_models = TRUE)

# Default plot for task
autoplot(task, type = "target")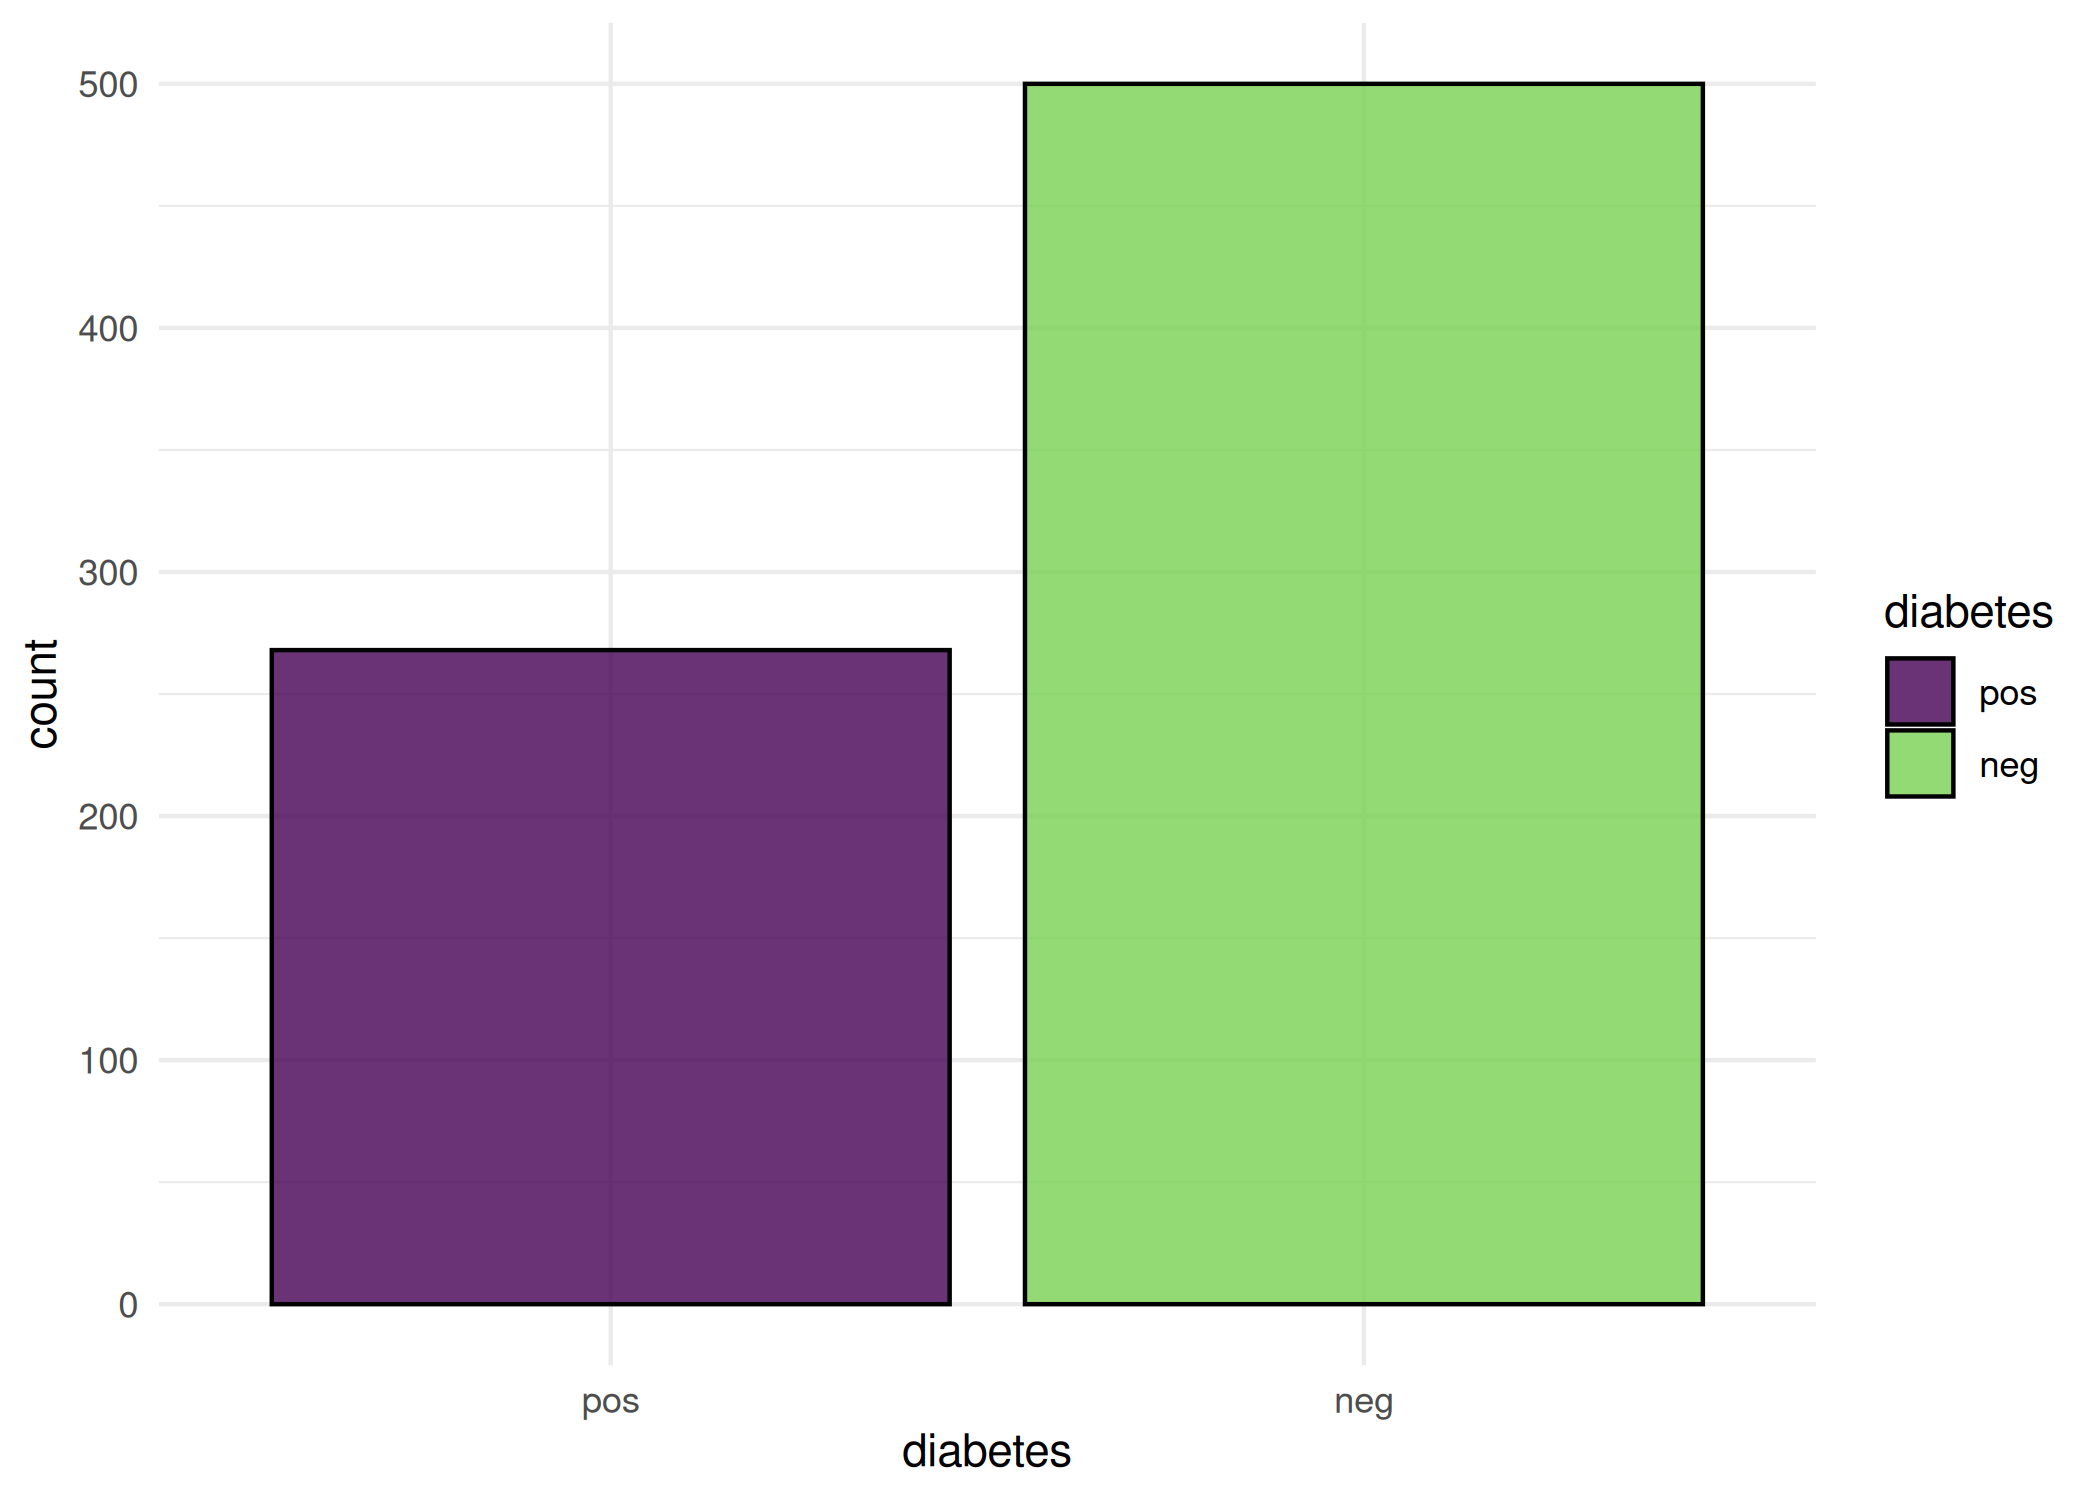
# ROC curve for resample result
autoplot(rr, type = "roc")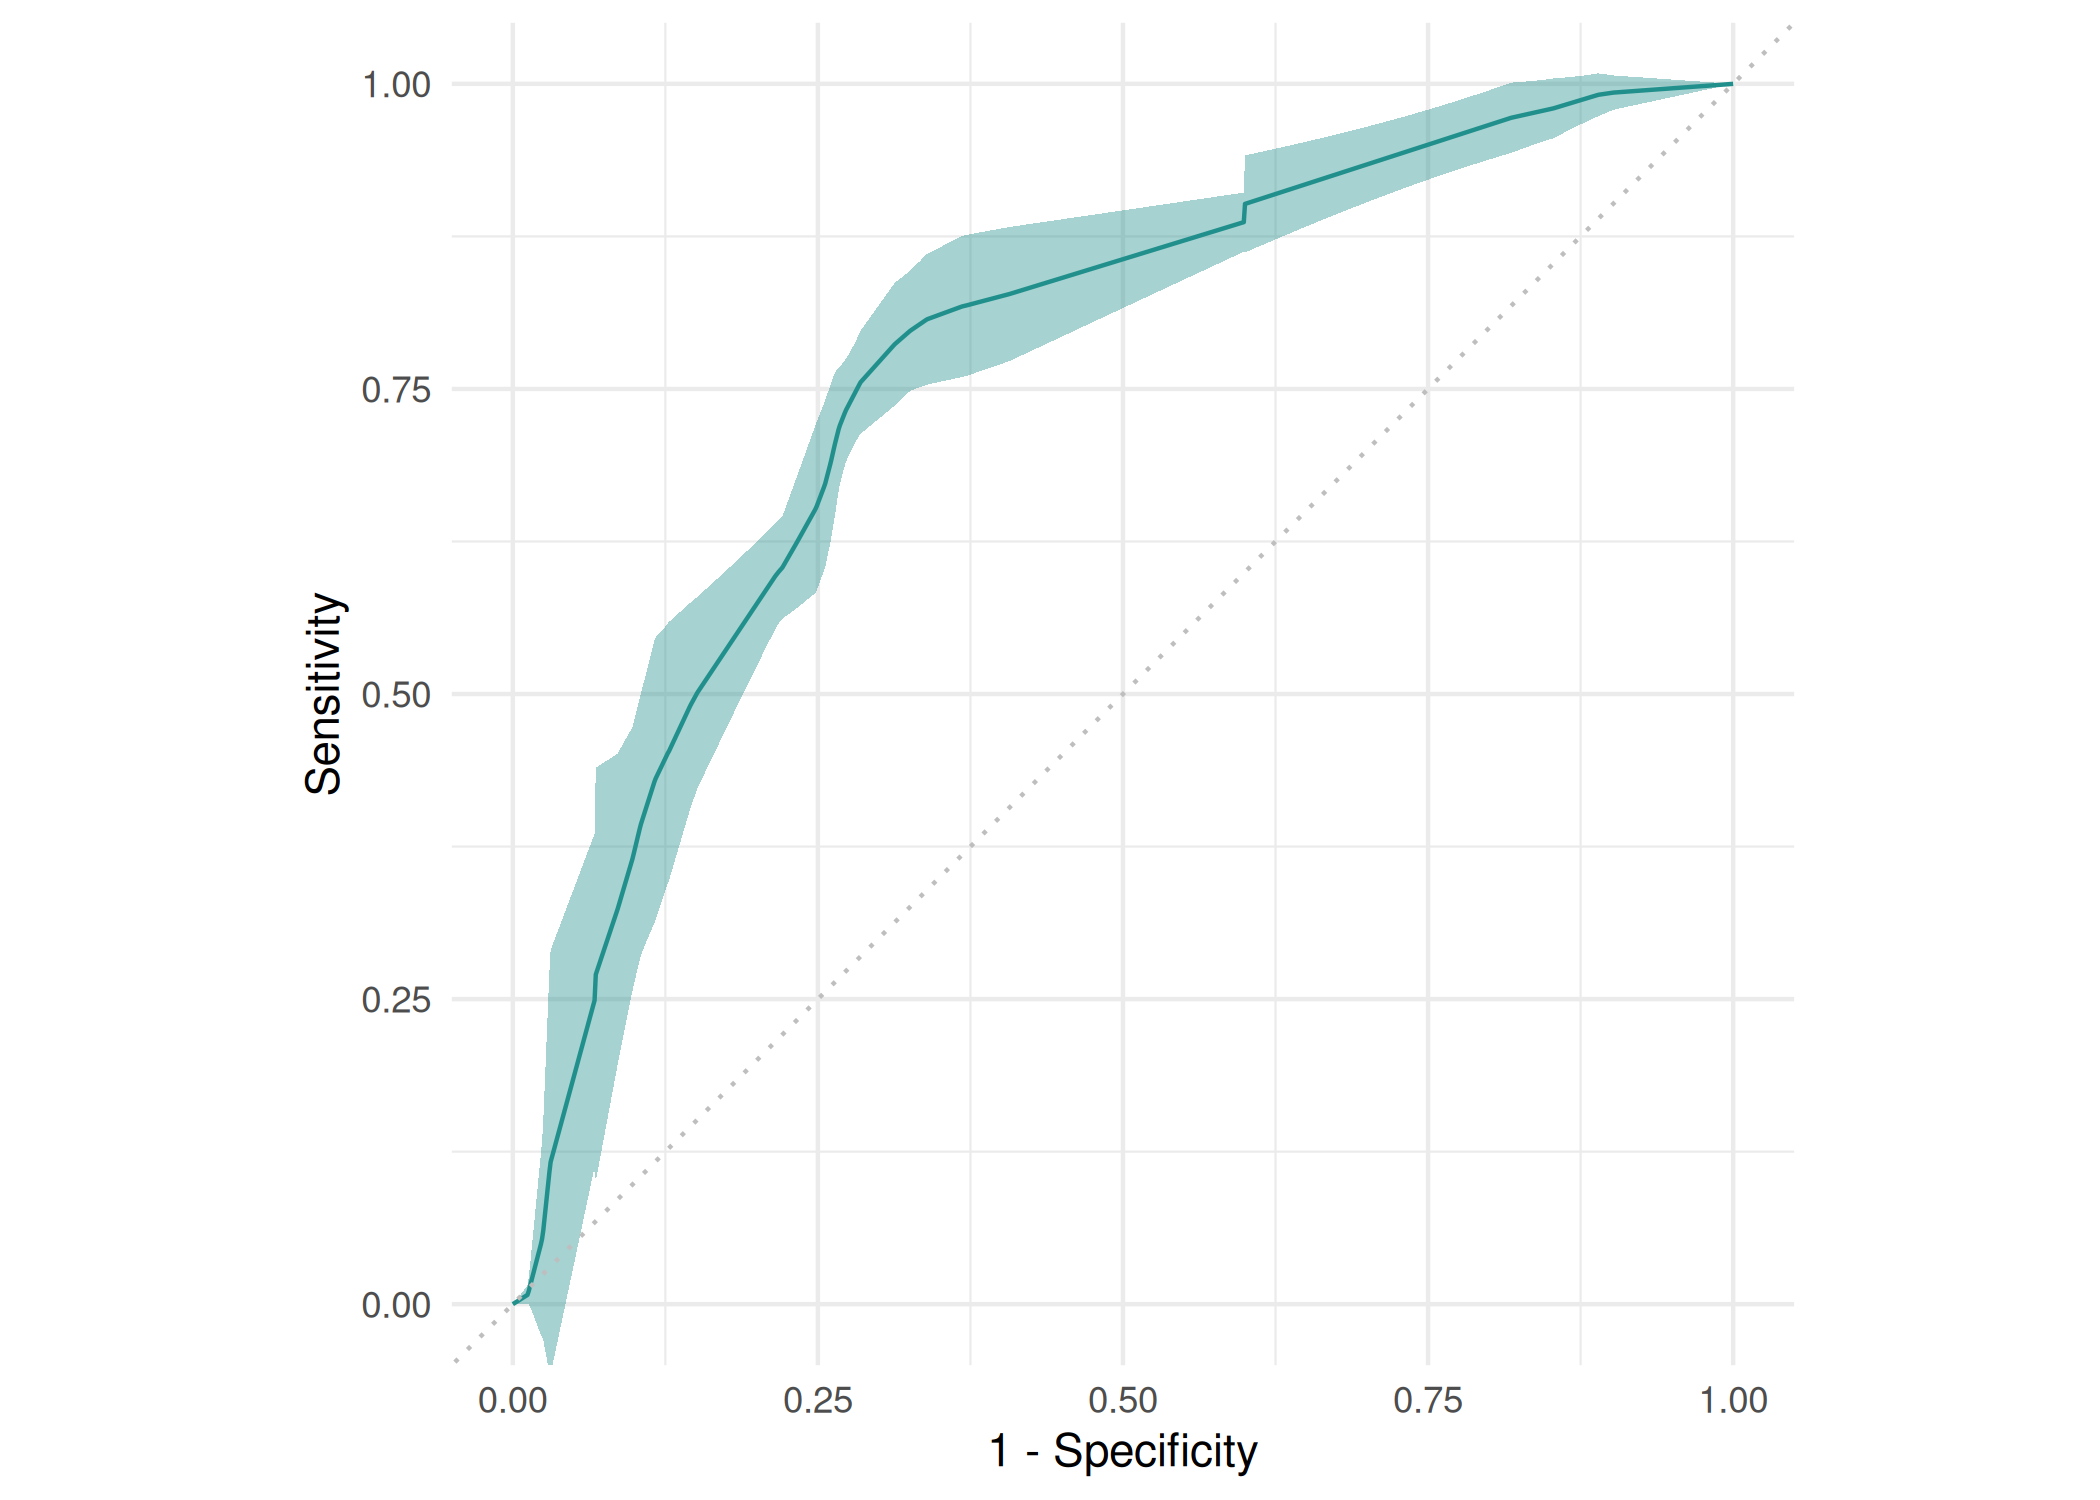
For more example plots you can have a look at the pkgdown references of the respective functions.
Need a high-speed mirror for your open-source project?
Contact our mirror admin team at info@clientvps.com.
This archive is provided as a free public service to the community.
Proudly supported by infrastructure from VPSPulse , RxServers , BuyNumber , UnitVPS , OffshoreName and secure payment technology by ArionPay.