![]()
![]()


labNorm provides functions for normalizing standard
laboratory measurements (e.g. hemoglobin, cholesterol levels) according
to age and sex. These normalizations are based on the algorithms
described in the research paper “Personalized lab test
models to quantify disease potentials in healthy individuals”.
This package allows users to easily obtain normalized values for their lab results and to project them on the population distribution. It can use reference distributions from Clalit HMO or UKBB. For more information go to: https://tanaylab.weizmann.ac.il/labs/
You can install the development version of labNorm from
GitHub using the remotes package:
retmotes::install_github("tanaylab/labNorm")Normalize hemoglobin values for a group of subjects:
library(labNorm)

# Add a column for the normalized values
hemoglobin_data$quantile <- ln_normalize(
    hemoglobin_data$value,
    hemoglobin_data$age,
    hemoglobin_data$sex,
    "Hemoglobin"
)
#> → Downloading to a temporary directory '/tmp/RtmpnrSi5j'.
#> → Extracting data to '/tmp/RtmpnrSi5j'.
#> → Extracting data to '/tmp/RtmpnrSi5j'.
#> ✔ Data downloaded successfully.

head(hemoglobin_data)
#>   age    sex value   quantile
#> 1  20   male  9.39 0.01882213
#> 2  20   male 14.03 0.18674720
#> 3  20   male 14.44 0.27947363
#> 4  20   male 15.80 0.75195053
#> 5  20 female 12.06 0.24249167
#> 6  20 female 12.89 0.57451617
Plot the quantiles vs values for age 50-60:
library(ggplot2)
library(dplyr)
#>
#> Attaching package: 'dplyr'
#> The following objects are masked from 'package:stats':
#>
#>     filter, lag
#> The following objects are masked from 'package:base':
#>
#>     intersect, setdiff, setequal, union

hemoglobin_data %>%
    filter(age >= 50 & age <= 60) %>%
    ggplot(aes(x = value, y = quantile, color = sex)) +
    geom_point() +
    theme_classic()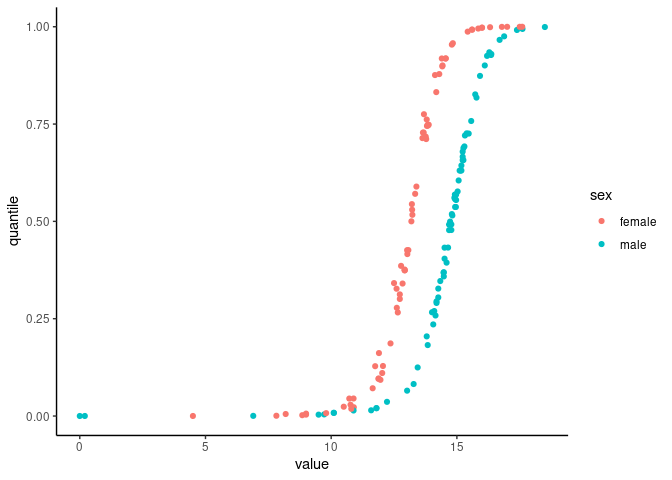
Plot the age/sex distribution of Hemoglobin:
ln_plot_dist("Hemoglobin")
Need a high-speed mirror for your open-source project?
Contact our mirror admin team at info@clientvps.com.
This archive is provided as a free public service to the community.
Proudly supported by infrastructure from VPSPulse , RxServers , BuyNumber , UnitVPS , OffshoreName and secure payment technology by ArionPay.