The objective of ggwidth is to standardise ‘ggplot2’ geom width.
It provides methods to ensure the width in ggplot2 geoms are visually consistent across plots with different numbers of categories, panel dimensions, and orientations.
It works with geoms such as
geom_bar/geom_col, geom_boxplot
and geom_errorbar.
Note this function requires:
"x" orientation plots to have a x discrete scale with
default expand"y" orientation plots to have a y discrete scale with
default expand.Install from CRAN, or development version from GitHub.
install.packages("ggwidth")
pak::pak("davidhodge931/ggwidth")library(ggplot2)
library(dplyr)
library(ggwidth)
library(patchwork)
set_theme(
theme_grey() +
theme(panel.widths = rep(unit(75, "mm"), 2)) +
theme(panel.heights = rep(unit(50, "mm"), 2))
)
set_equiwidth(1)p1 <- mpg |>
ggplot(aes(x = drv)) +
geom_bar(
width = get_width(n = 3),
colour = "black",
fill = "grey",
)
p2 <- diamonds |>
ggplot(aes(x = color)) +
geom_bar(
width = get_width(n = 7),
colour = "black",
fill = "grey",
)
p3 <- diamonds |>
ggplot(aes(y = color)) +
geom_bar(
width = get_width(n = 7, orientation = "y"),
colour = "black",
fill = "grey",
)
p4 <- mpg |>
ggplot(aes(x = drv, group = factor(cyl))) +
geom_bar(
position = position_dodge(preserve = "single"),
width = get_width(n = 3, n_dodge = 4),
colour = "black",
fill = "grey",
)
p1 + p2 + p3 + p4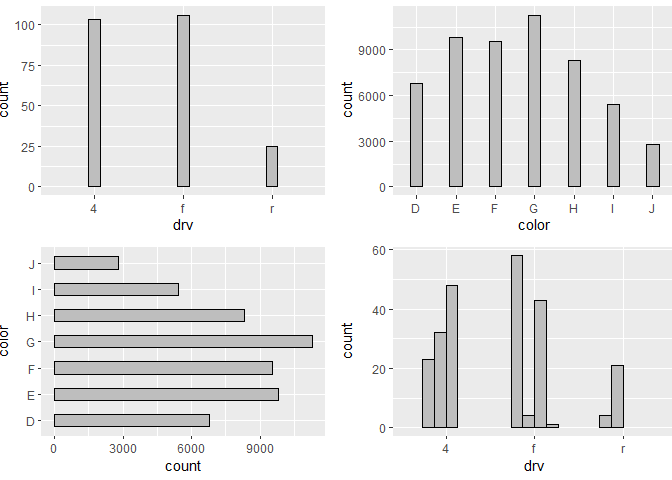
d <- tibble::tibble(
  continent = c("Europe", "Europe", "Europe", "Europe", "Europe",
                "South America", "South America"),
  country   = c("AT", "DE", "DK", "ES", "PK", "TW", "BR"),
  value     = c(10L, 15L, 20L, 25L, 17L, 13L, 5L)
)

max_n <- d |>
  count(continent) |>
  pull(n) |>
  max()

d |>
  mutate(country = forcats::fct_rev(country)) |>
  ggplot(aes(y = country, x = value)) +
  geom_col(
    width = get_width(n = max_n, orientation = "y"),
    colour = "black",
    fill = "grey",
  ) +
  facet_wrap(~continent, scales = "free_y") +
  scale_y_discrete(continuous.limits = c(1, max_n)) +
  coord_cartesian(reverse = "y", clip = "off")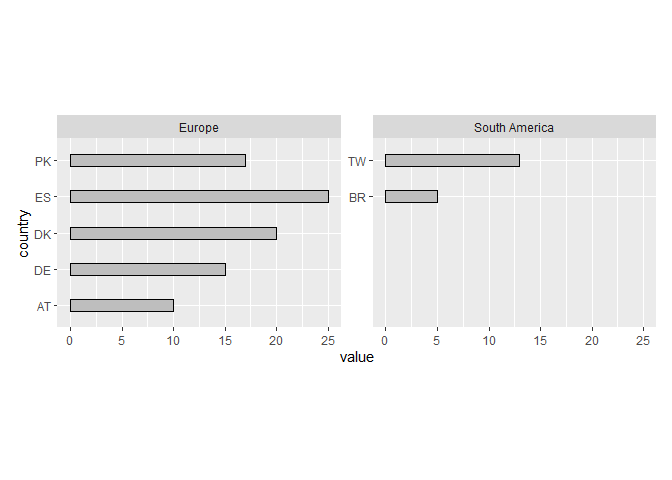
mpg |>
  ggplot(aes(x = drv)) +
  geom_bar(
    width = get_width(n = 3, panel_widths = unit(160, "mm")),
    colour = "black",
    fill = "grey",
  ) +
  theme(panel.widths = unit(160, "mm"))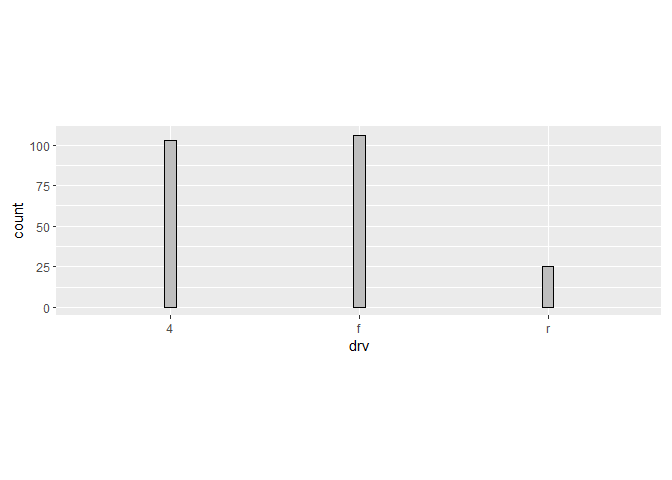
This package is part of a group of related packages built to extend ggplot2.
|
|
|
|
|
|
|
Need a high-speed mirror for your open-source project?
Contact our mirror admin team at info@clientvps.com.
This archive is provided as a free public service to the community.
Proudly supported by infrastructure from VPSPulse , RxServers , BuyNumber , UnitVPS , OffshoreName and secure payment technology by ArionPay.