![]()
![]()
ggtrace provides ggplot2 geoms that allow groups of data points to be outlined or highlighted for emphasis. This is particularly useful when working with dense datasets that are prone to overplotting.
You can install the released version from CRAN:
install.packages("ggtrace")and the development version from GitHub:
devtools::install_github("rnabioco/ggtrace")geom_point_trace() accepts graphical parameters normally
passed to ggplot2::geom_point() to control the appearance
of data points and outlines. The trace_position argument
can be used to select specific sets of points to highlight. For more
examples see the vignette.
library(ggplot2)
library(ggtrace)

ggplot(clusters, aes(UMAP_1, UMAP_2, color = cluster)) +
  geom_point_trace(
    trace_position    = signal < 0,
    fill              = "white",
    background_params = list(color = NA, fill = "grey85")
  ) +
  theme_minimal()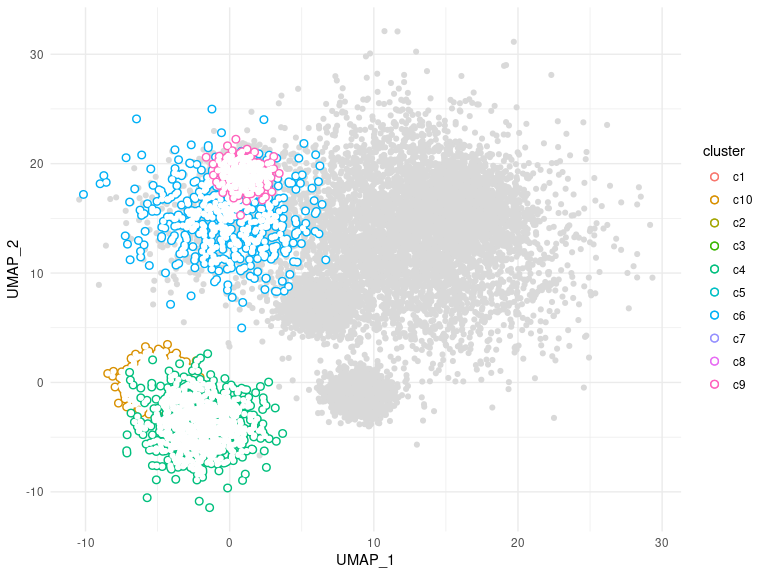
geom_line_trace() accepts parameters normally passed to
ggplot2::geom_line() with the following exceptions:
fill controls the inner line color, color
controls the outline color, and stroke controls outline
width. Like geom_point_trace(), the
trace_position argument can be used to select specific data
points to highlight. For more examples see the vignette.
ggplot(stocks, aes(day, value, color = name)) +
  geom_line_trace(
    trace_position    = day < 500 | day > 1500,
    stroke            = 1,
    background_params = list(color = NA, fill = "grey75")
  ) +
  theme_minimal()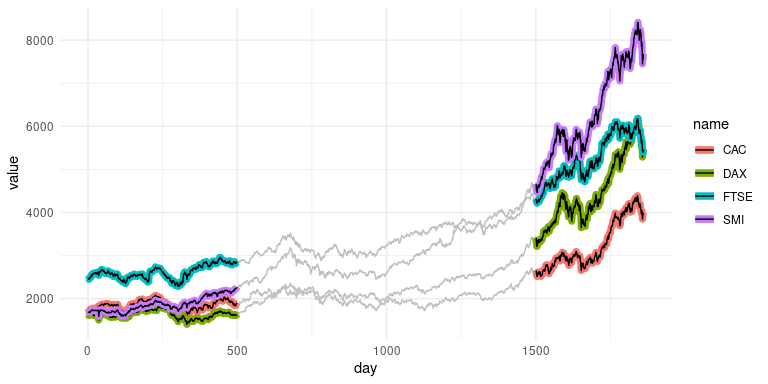
Need a high-speed mirror for your open-source project?
Contact our mirror admin team at info@clientvps.com.
This archive is provided as a free public service to the community.
Proudly supported by infrastructure from VPSPulse , RxServers , BuyNumber , UnitVPS , OffshoreName and secure payment technology by ArionPay.