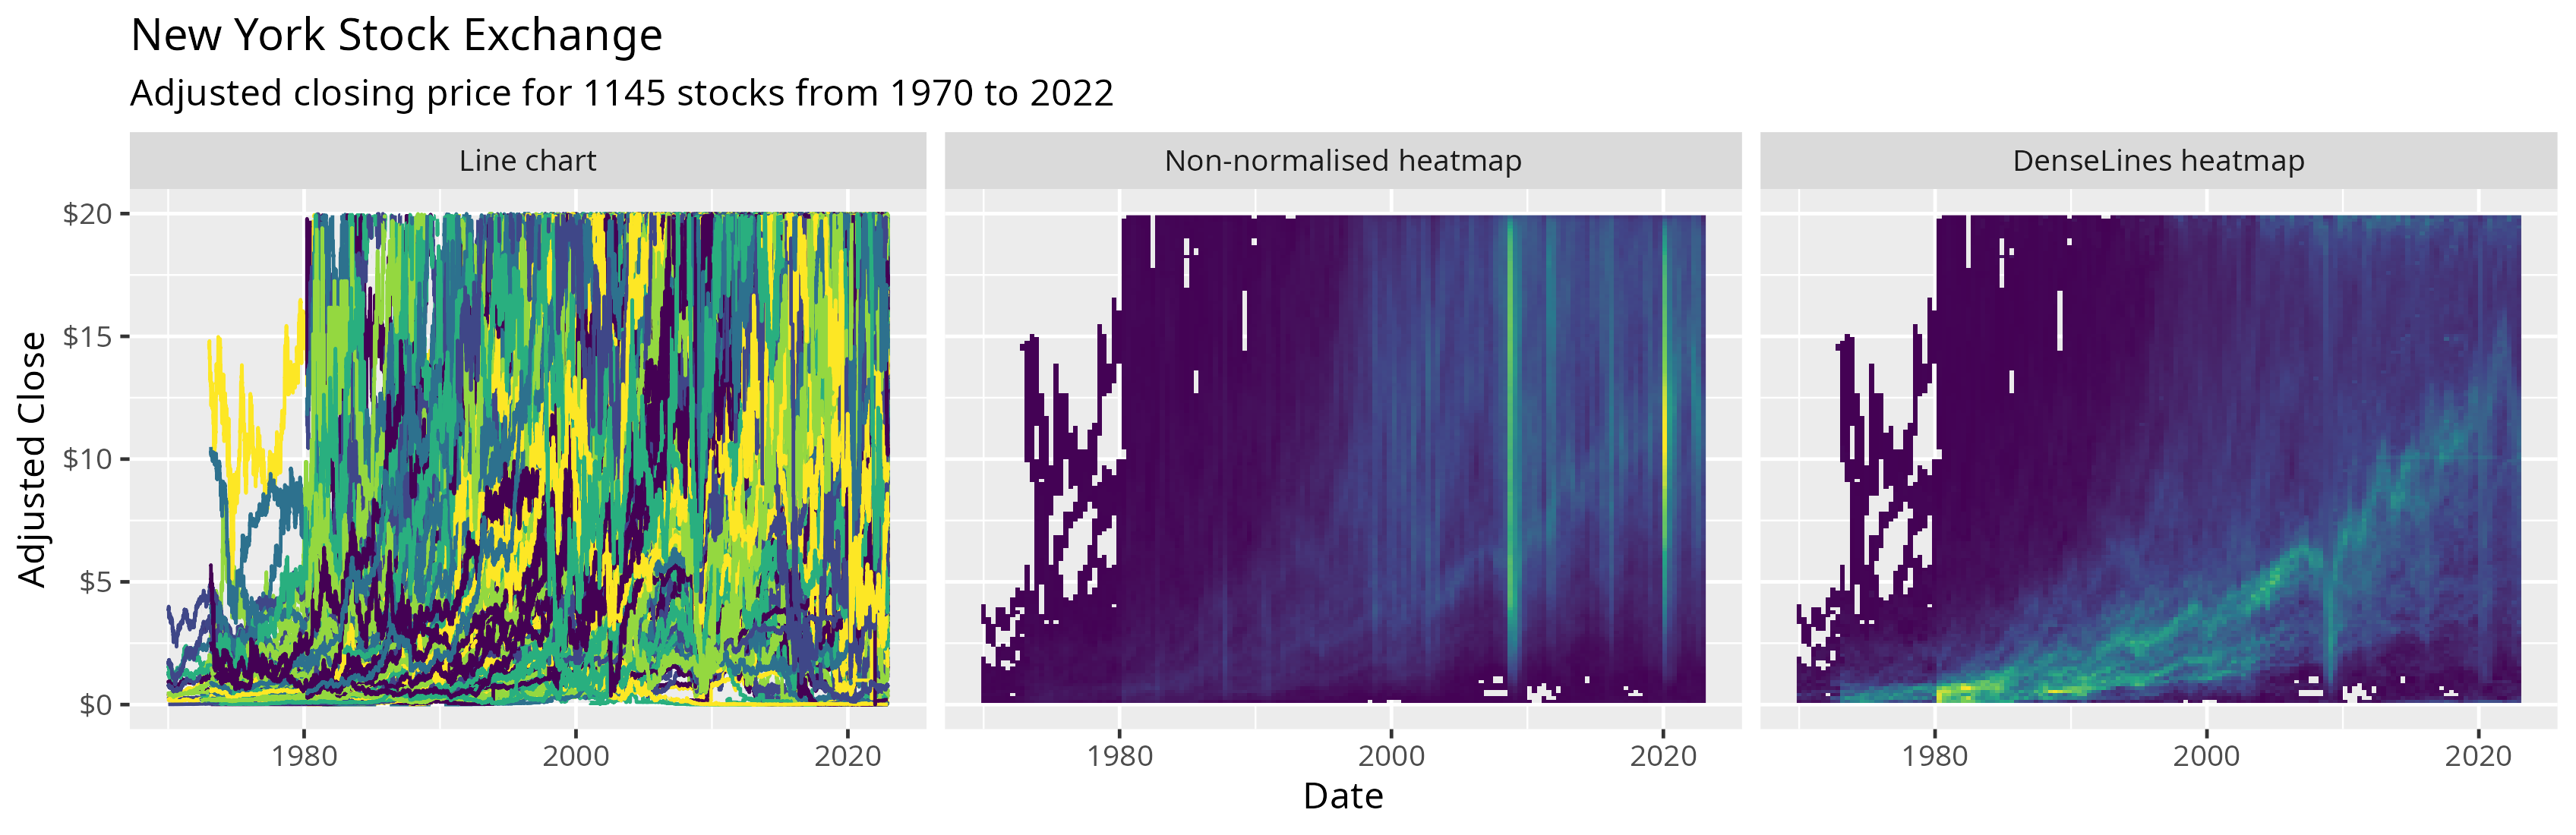
The goal of gglinedensity is to bring the DenseLines algorithm to R via ggplot2, providing a “derived density visualisation (that) allows users both to see the aggregate trends of multiple (time) series and to identify anomalous extrema” (Moritz and Fisher, 2018).
You can install gglinedensity like so:
install.packages("gglinedensity")You can install the development version of gglinedensity like so:
# install.packages("pak")
pak::pak("hrryt/gglinedensity")This is a basic example which shows you how to create a DenseLines heatmap:
library(ggplot2)
library(gglinedensity)

ggplot(txhousing, aes(date, median, group = city)) +
  stat_line_density(bins = 50, drop = FALSE, na.rm = TRUE)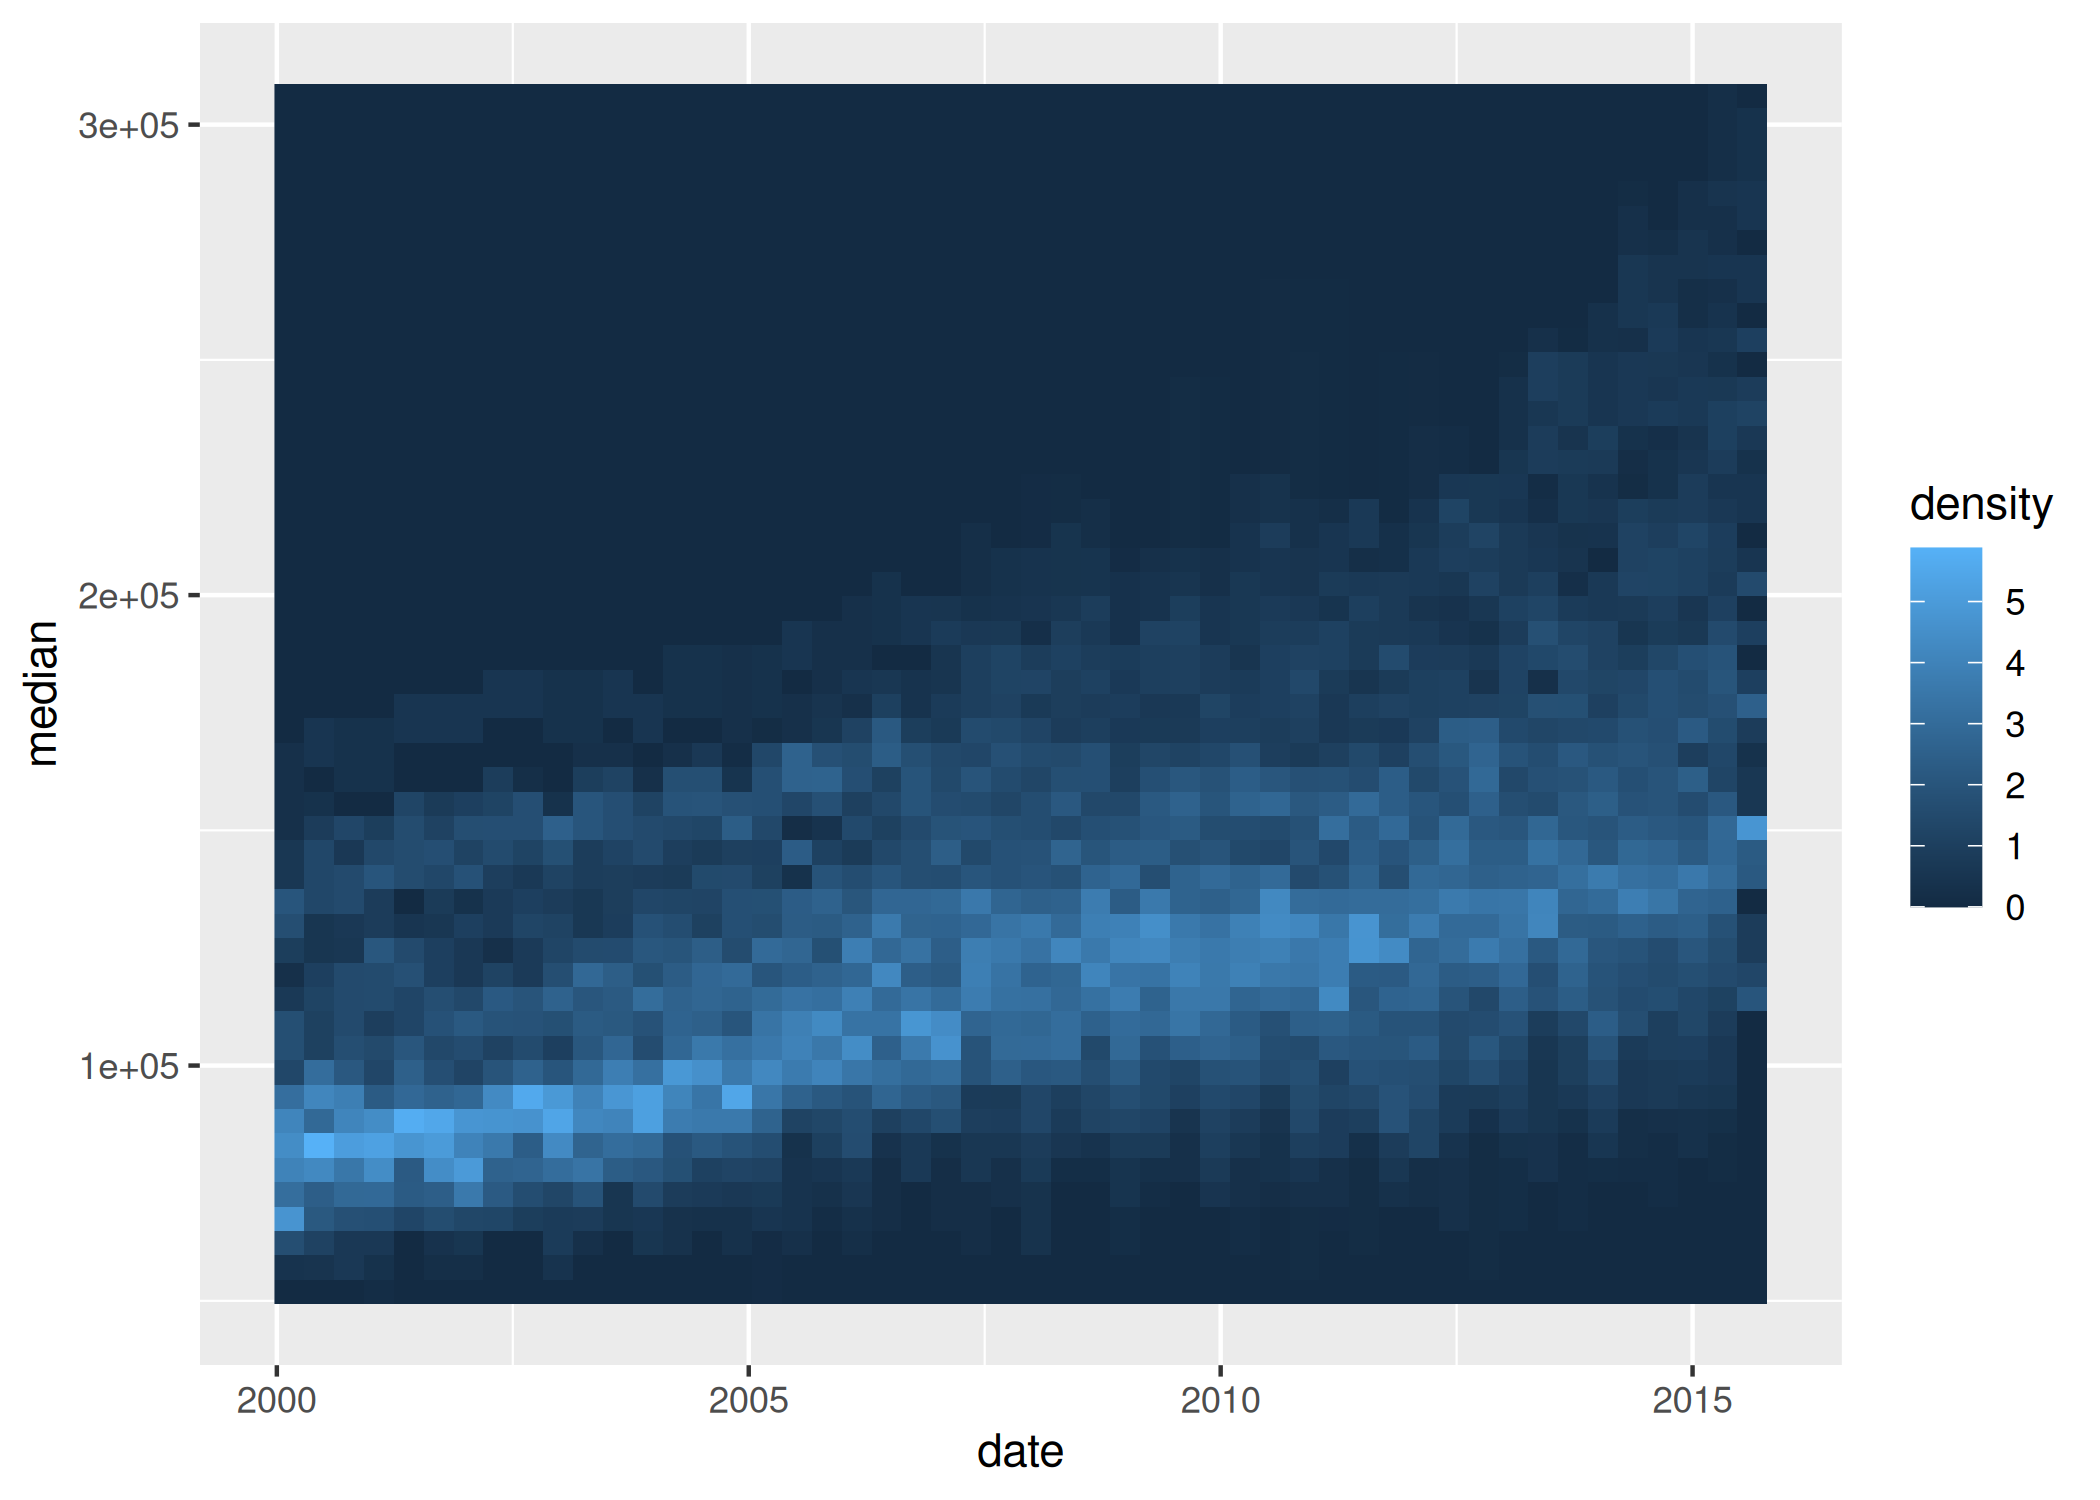
You can also calculate the number of paths crossing a given bin, without using the DenseLines algorithm:
ggplot(dplyr::storms, aes(long, lat, group = name)) +
    borders(colour = NA, fill = "grey50") +
    stat_path_density(geom = "tile", binwidth = 1.25, na.rm = TRUE) +
    borders() +
    xlim(-180, 0) +
    ylim(-40, 80) +
    coord_sf(
        crs = sf::st_crs(5070),
        default_crs = sf::st_crs(4326),
        xlim = c(-120, -30), ylim = c(0, 70)
    ) +
    theme(panel.background = element_rect(fill = "grey10"))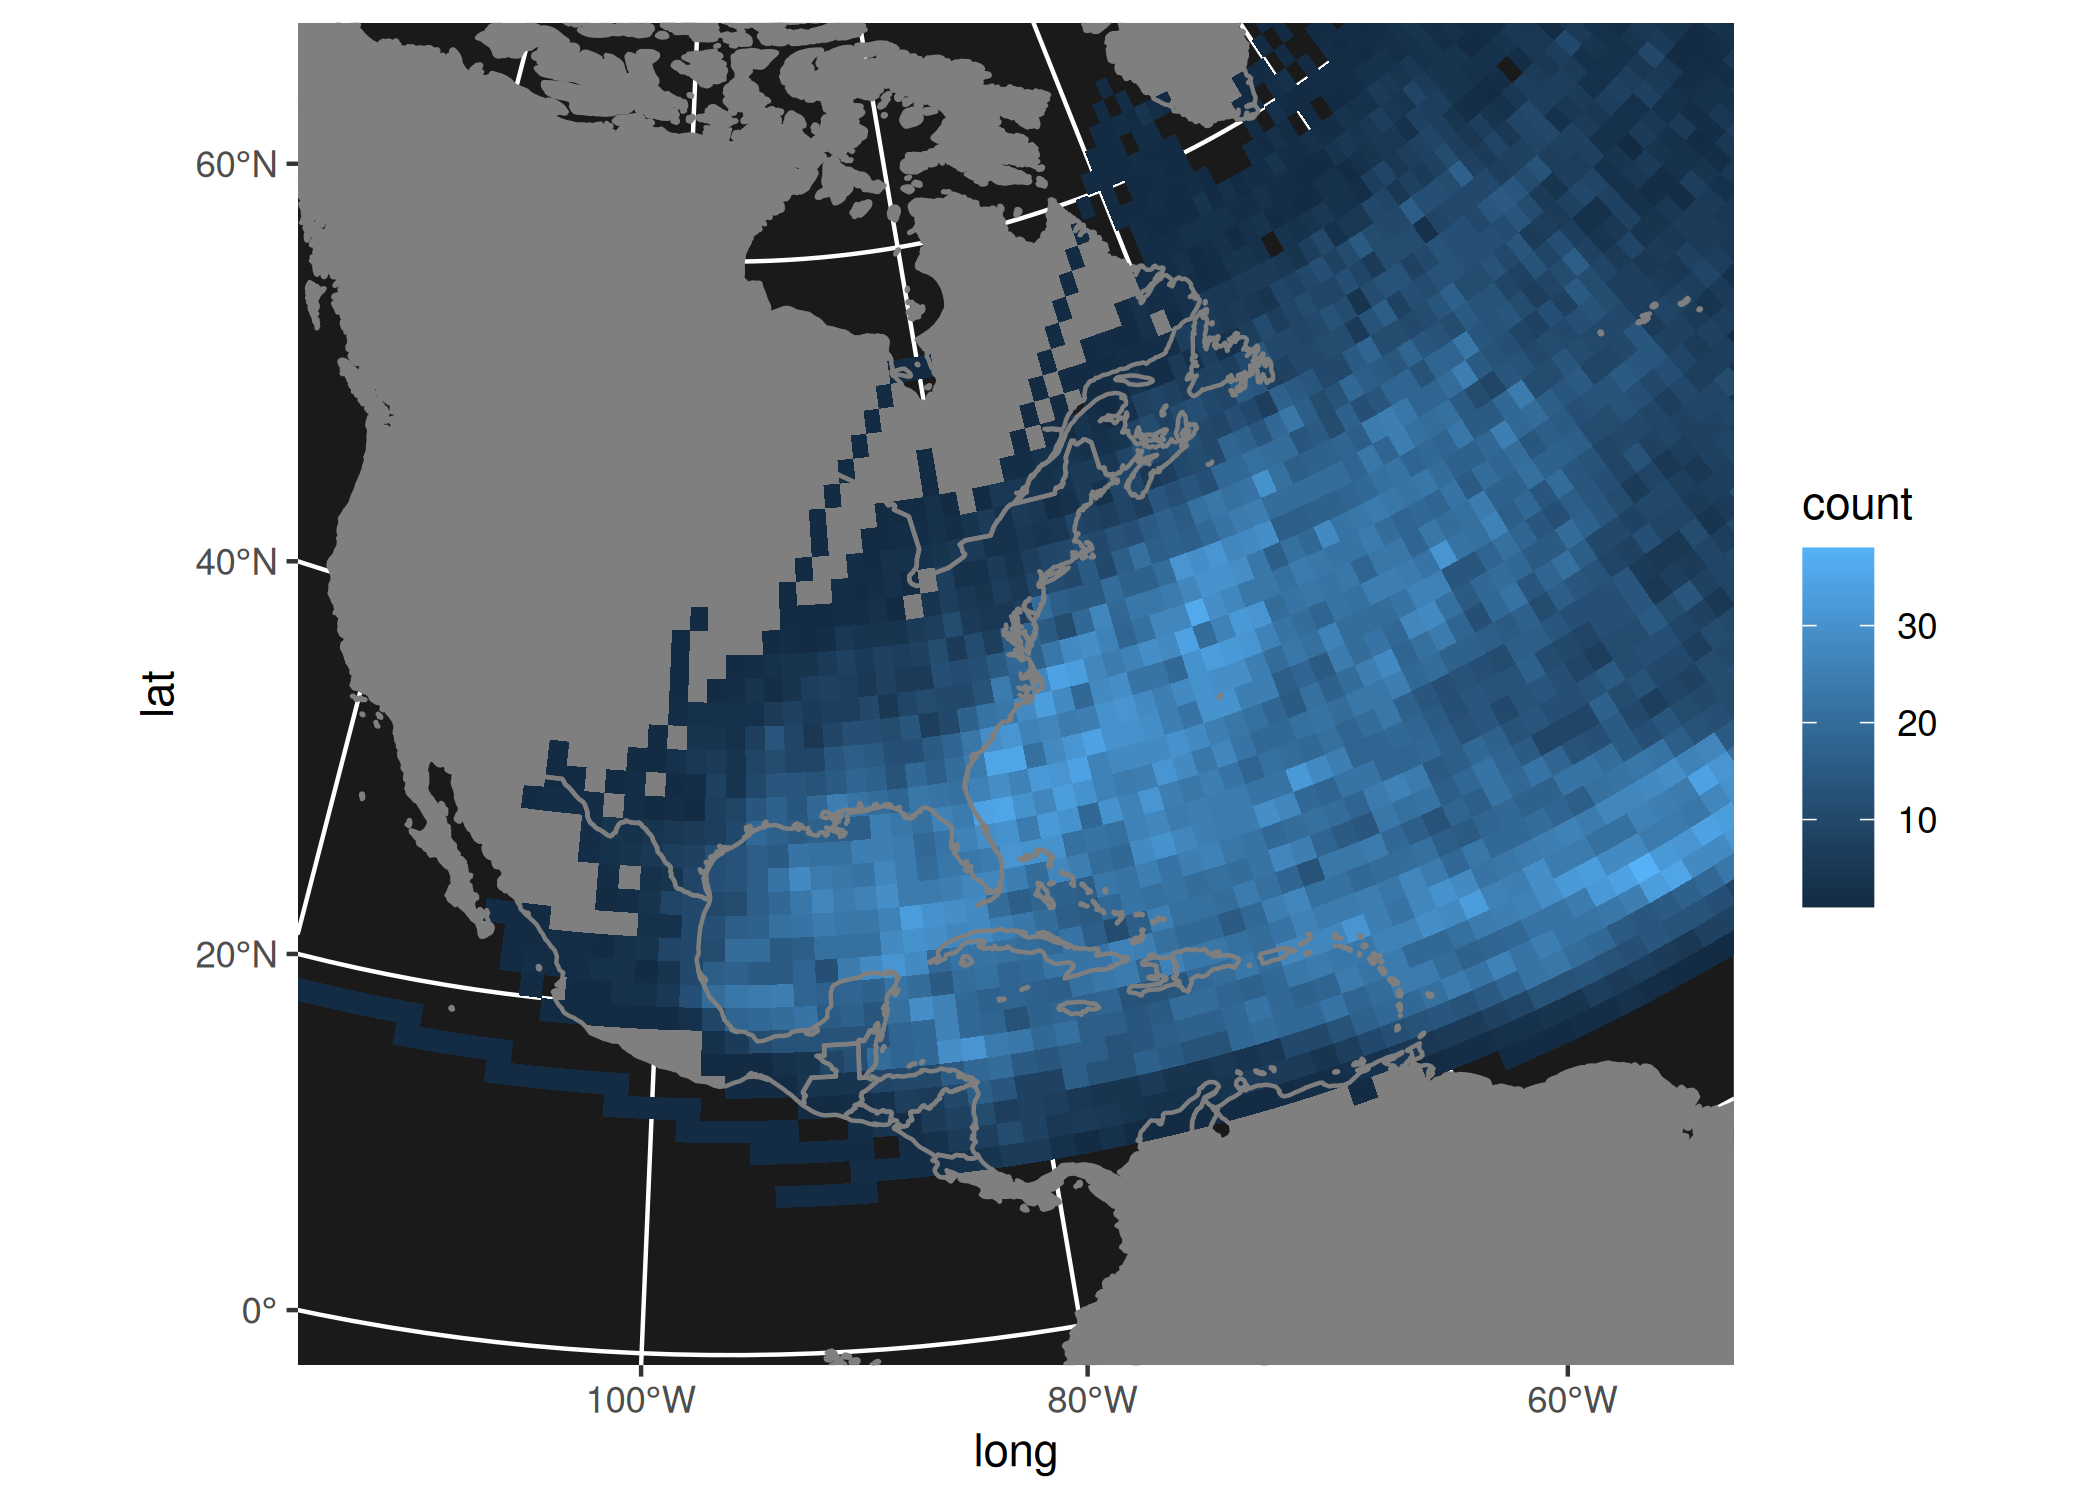
Need a high-speed mirror for your open-source project?
Contact our mirror admin team at info@clientvps.com.
This archive is provided as a free public service to the community.
Proudly supported by infrastructure from VPSPulse , RxServers , BuyNumber , UnitVPS , OffshoreName and secure payment technology by ArionPay.