![]()
Highlight geoms in ggplot2.
install.packages("gghighlight")

# Or the development version from GitHub:
# install.packages("devtools")
devtools::install_github("yutannihilation/gghighlight")(For the full version, please refer to Introduction to gghighlight).
Suppose we have a data that has so many series that it is hard to identify them by their colours as the differences are so subtle.
library(ggplot2)

ggplot(d) +
  geom_line(aes(idx, value, colour = type))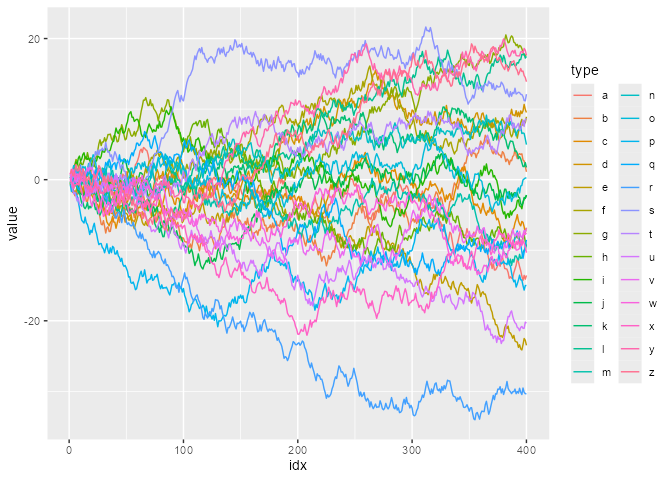
With gghighlight(), we can highlight the lines whose max
values are larger than 20:
library(gghighlight)

p <- ggplot(d) +
  geom_line(aes(idx, value, colour = type)) +
  gghighlight(max(value) > 20)
#> label_key: type

p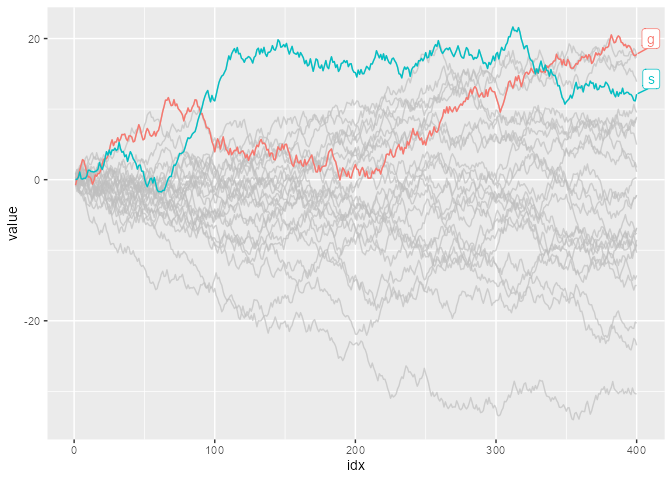
The result is a usual ggplot object, so it is fully customizable. For example, it can be used with custom themes and facets.
p + theme_minimal()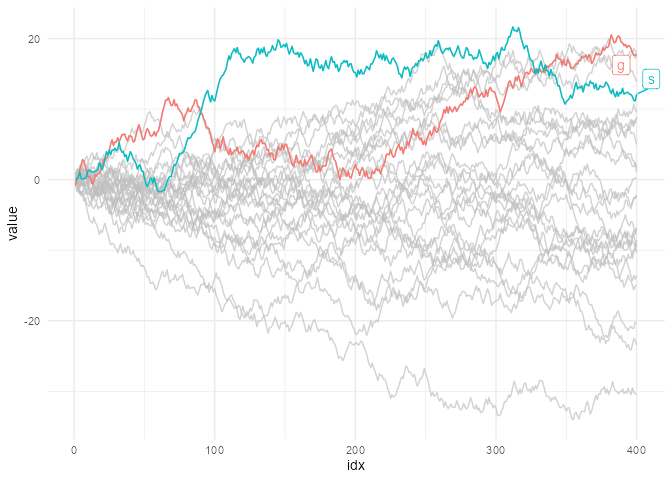
p + theme_minimal() + facet_wrap(~ type)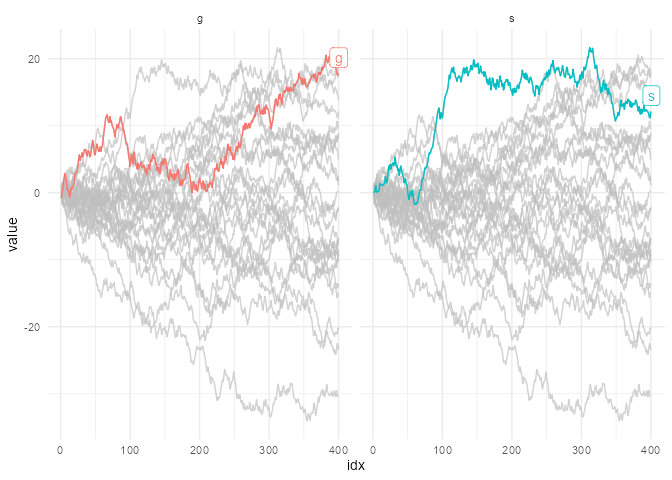
gghighlight() can highlight almost any geoms. For more
details, please read Introduction
to gghighlight.
Need a high-speed mirror for your open-source project?
Contact our mirror admin team at info@clientvps.com.
This archive is provided as a free public service to the community.
Proudly supported by infrastructure from VPSPulse , RxServers , BuyNumber , UnitVPS , OffshoreName and secure payment technology by ArionPay.