The goal of gallery is to replicate the MATLAB
gallery of test matrices in R.
You can install the released version of gallery from GitHub with:
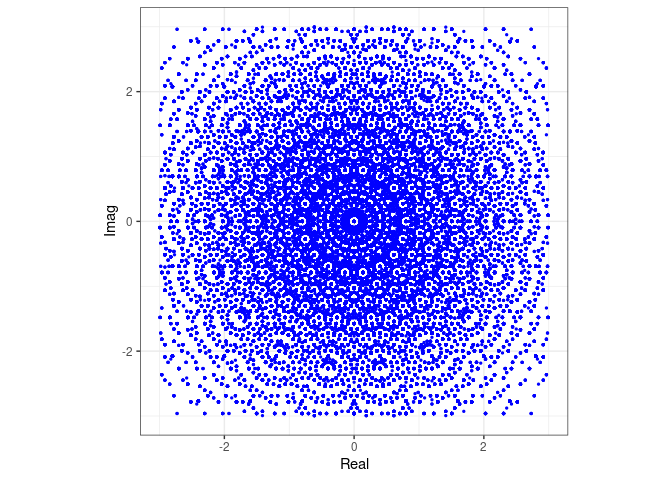
devtools::install_github("tXiao95/gallery")This example can be found on the MATLAB website. We will plot the distribution of eigenvalues from a sample of 20,000 random circulant matrices of size 18 by 18 in the complex plane.
library(gallery)
library(ggplot2)

E <- matrix(0, nrow = 18, ncol = 20000)

for(i in 1:20000){
  x <- -0.4 + 0.8*sample(0:1, 18, replace = TRUE)
  A <- gallery::circul(x)
  E[,i] <- eigen(A, only.values = TRUE)$values
}

df <- data.frame(Real = Re(c(E)), Imag = Im(c(E)))

ggplot(df, aes(Real, Imag)) +
  geom_point(col = "blue", size = 0.5) +
  scale_x_continuous(limits=c(-3,3)) +
  scale_y_continuous(limits=c(-3,3)) +
  coord_fixed(ratio=1) +
  theme_bw()
#> Warning: Removed 10249 rows containing missing values or values outside the scale range
#> (`geom_point()`).
Need a high-speed mirror for your open-source project?
Contact our mirror admin team at info@clientvps.com.
This archive is provided as a free public service to the community.
Proudly supported by infrastructure from VPSPulse , RxServers , BuyNumber , UnitVPS , OffshoreName and secure payment technology by ArionPay.