

cetcolor)
The cetcolor
package is designed to bring to R the 56 colour maps created by
Peter Kovesi
that avoid points of locally high colour contrast leading to the
perception of false anomalies in your data when there is none. The
colour maps have been designed to avoid this phenomenon by having
uniform perceptual contrast over their whole range.
The cetcolor package is available on both CRAN and
GitHub. The CRAN version is considered stable while the GitHub version
is in a state of development and may break.
You can install the stable version of the cetcolor
package with:
install.packages("cetcolor")For the development version, you can opt for:
install.packages("devtools")
devtools::install_github("coatless/cetcolor")# Load the Library
library("cetcolor")
# Get RGB Hexadecimals for graphing
cet_pal(5, name = "blues")
#> [1] "#F1F1F1" "#C0D3EB" "#93B5DD" "#7197C1" "#3B7CB2"
# Sample use with ggplot2
library("ggplot2")
ggplot(faithfuld, aes(waiting, eruptions)) +
geom_raster(aes(fill = density)) +
theme_bw() + theme(panel.grid=element_blank()) -> g
library("gridExtra")
# Frequently used colour maps have "nicknames" see ?cet_color_maps
grid.arrange(
g + scale_fill_gradientn(colours = cet_pal(5, name = "fire")),
g + scale_fill_gradientn(colours = cet_pal(5, name = "inferno")),
g + scale_fill_gradientn(colours = cet_pal(5, name = "blues")),
g + scale_fill_gradientn(colours = cet_pal(5, name = "kgy")),
ncol = 2, nrow = 2
)
# Show a panel of possible values (without nicknames)
display_cet_all()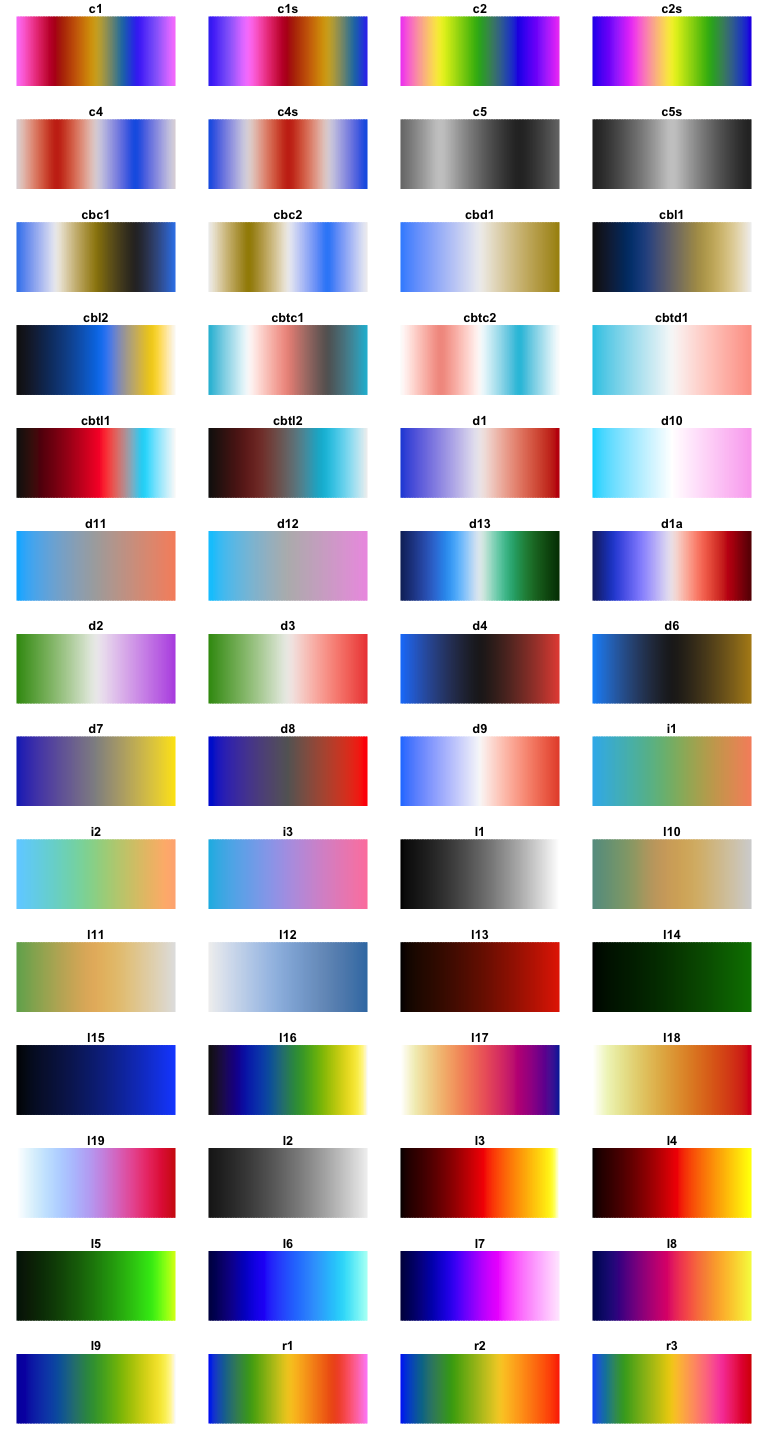
viridis
(Source)
RColorBrewer
(Source)
cet_pal(n, name), and
colour map displays.scales
and ggplot2
ggplot2
as shown for RColorBrewer.CC BY-SA 4.0
Need a high-speed mirror for your open-source project?
Contact our mirror admin team at info@clientvps.com.
This archive is provided as a free public service to the community.
Proudly supported by infrastructure from VPSPulse , RxServers , BuyNumber , UnitVPS , OffshoreName and secure payment technology by ArionPay.