

This package utilizes various viz packages (currently dittoViz, plotthis, and ComplexHeatmap along with native plotting functions) to create interactivity-first Shiny modules for common plot types, designed to serve as building blocks for Shiny apps and as the basis for more complex/specialized modules.
These modules contain all possible functionality for each plot with some additional parameters that make use of the interactive features of plotly, e.g. interactive text annotations, arbitrary shape annotations, multiple download formats, etc.
The modules provide comprehensive plot control for app users, allowing for convenient aesthetic customizations and publication-quality images. They also provide developers a way to dramatically save time and reduce complexity of their plotting code or a flexible base to build more specialized Shiny modules upon.
This package is still in an experimental state undergoing active development. While each release should be stable and useable, breaking changes may occur frequently between versions until a major 1.0.0 release is made.
# CRAN
install.packages("VizModules")

# Development version
remotes::install_github("j-andrews7/VizModules")VizModules::moduleGalleryApp()VizModules::figureBuilderApp()vignette("quick-start", package = "VizModules")To use a module in your own app, simply call the
*InputsUI(), *OutputUI(), and
*Server() functions for the module you want to use. For
example, to use the ScatterPlot module from dittoViz, you would do
something like this:
library(VizModules)

ui <- fluidPage(
    sidebarLayout(
        sidebarPanel(
            dittoViz_scatterPlotInputsUI(
                "cars",
                mtcars,
                defaults = list(
                    x.by = "wt",
                    y.by = "mpg",
                    color.by = "cyl"
                )
            )
        ),
        mainPanel(dittoViz_scatterPlotOutputUI("cars"))
    )
)

server <- function(input, output, session) {
    dittoViz_scatterPlotServer(
        "cars",
        data = reactive(mtcars)
    )
}

shinyApp(ui, server)
Every module uses the same trio of functions:
*InputsUI() for controls, *OutputUI() for the
plot, and *Server() for the logic. The separation of
InputsUI and OutputUI allows you to place input controls and the actual
plot wherever you’d like.
Use defaults to pre-fill inputs, and
hide.inputs/hide.tabs to hide controls while
keeping their values so you can enforce app-level defaults without
exposing them. A defaults entry can also be a
reactive(), so an input follows your app’s state without an
extra re-render.
Modules built on plotting functions from other packages expose most
of the underlying arguments. The module input help pages (e.g.,
?dittoViz_scatterPlotInputsUI,
?plotthis_AreaPlotInputsUI) list what is wired through and
any omissions; cross-reference the underlying plot docs
(?dittoViz::scatterPlot, ?plotthis::AreaPlot,
etc.) to see the full parameter set.
Every module has a corresponding *App() function that
creates a complete Shiny app showcasing the module’s functionality with
example data. For instance, plotthis_BarPlotApp() creates
an app BarPlot module. You can run these apps directly to explore the
module’s features and see how it works in a full Shiny context.
library(VizModules)
# Using built-in example data (or upload your own file in the app)
plotthis_BarPlotApp()

# Providing your own data
df <- data.frame(
    category = c("A", "B", "C"),
    value = c(10, 20, 15),
    group = c("X", "Y", "X")
)

plotthis_BarPlotApp(data = df)Every built-in *App() convenience function
(e.g. plotthis_BarPlotApp(), linePlotApp()) is
a thin wrapper around createModuleApp() with sensible
default data. You can also pass your own custom wrapper module functions
to createModuleApp() for rapid prototyping after defining
the UI and server functions. All *App() wrappers and
createModuleApp() accept defaults,
hide.inputs, and hide.tabs so you can pre-fill
or hide controls when testing a module in isolation; see vignette("defaults-and-hiding", package = "VizModules").
library(VizModules)

app <- createModuleApp(
    inputs_ui_fn = plotthis_BarPlotInputsUI,
    output_ui_fn = plotthis_BarPlotOutputUI,
    server_fn    = plotthis_BarPlotServer,
    data_list    = list("cars" = mtcars),
    title        = "My Bar Plot"
)

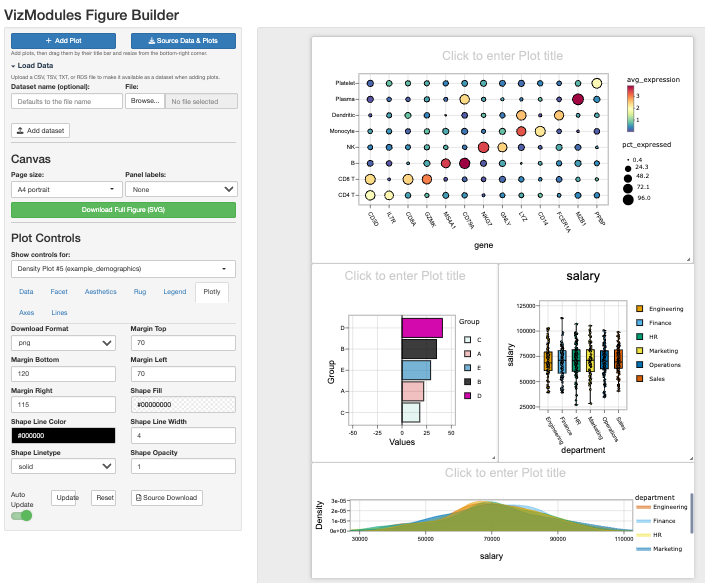
runApp(app)The Figure Builder is a fully reusable, namespaced
Shiny module (figureBuilderUI() /
figureBuilderServer()) that turns the plot modules into a
free-form figure builder. It can be launched as a standalone app,
embedded inside a larger app, or even instantiated more than once on a
single page. It is also the Figure Builder tab of the
gallery (moduleGalleryApp(), or the hosted
gallery). Launch the standalone app with
figureBuilderApp():
library(VizModules)

# Launch with the bundled example datasets and all modules
figureBuilderApp()

# Or seed it with your own datasets
figureBuilderApp(data_list = list("iris" = iris, "mtcars" = mtcars))
figureBuilderApp() accepts data_list to
seed datasets, module_registry to add custom modules, and
return_components = TRUE to get separate
ui/server objects instead of a
shinyApp(). See ?figureBuilderApp for
details.
The Figure Builder is also a self-contained Shiny module, so you can
embed it in a larger app (and even use more than one instance on a page)
with figureBuilderUI() /
figureBuilderServer(), just like the plot modules:
library(VizModules)

ui <- fluidPage(
    figureBuilderUI("figure_builder")
)

server <- function(input, output, session) {
    figureBuilderServer("figure_builder")
}

shinyApp(ui, server)
It allows you to interactively compose complicated figures using the modules in a single page:
CSV, TSV or tab-delimited
TXT file. Uploaded datasets are added to the dataset list
so you can build plots from your own data alongside the bundled
examples. Each plot can use a different dataset if desired.shinyjqui) — resizing adjusts the plot in both directions.
The toolbar stays out of the way otherwise, so cards remain clean and
chrome-free in the SVG export.A,
B, C, … or lowercase a,
b, c, …) to the top-left of each panel. Labels
now render live on the canvas as soon as they are chosen (and renumber
as panels are added, removed, or dragged), in addition to appearing in
the SVG export. Labels are ordered the way a reader scans a figure —
top-to-bottom by row, then left-to-right within a row. Choose
None to leave the figure unlabelled..zip containing all plot
data (plot + data + the inputs used to build it + statistical testing
information (if applied)) for every plot on the canvas, with one set of
files per panel.The modules in VizModules are designed to be
composed and extended. You can build higher-level modules that add
custom logic while reusing the full functionality of the base modules.
Many internal helpers for axes, faceting, and layouts are now exported
to support this, along with the
defaults/hide.inputs/hide.tabs
controls covered in vignette("defaults-and-hiding", package = "VizModules").
For more details, see vignette("custom-modules", package = "VizModules").
Beyond the standard shiny::*Input widgets,
VizModules ships two reusable custom Shiny inputs that
are used throughout the package and are available for your own apps:
multiColorPicker() and multiDynamicInput().
See vignette("custom-shiny-inputs", package = "VizModules")
for full details.
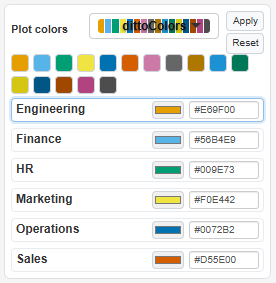
multiColorPicker() assigns a color to
each level of a discrete variable, either by applying a named palette to
every group at once or by fine-tuning individual groups with a color
picker and an editable hex field. It returns a named character vector of
hex colors keyed by group and can be updated from the server with
updateMultiColorPicker().
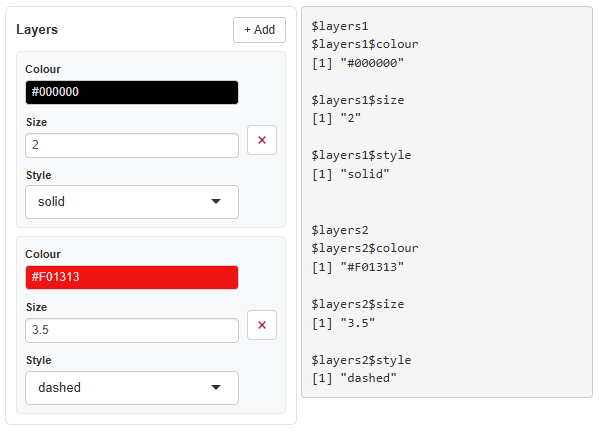
multiDynamicInput() is a
general-purpose widget that lets users dynamically add and remove rows
of heterogeneous inputs (e.g. a color, a numeric, and a select per row).
It returns a named list of rows and can be updated from the server with
updateMultiDynamicInput().
Currently, VizModules contains a functional Shiny module for the following visualization functions:
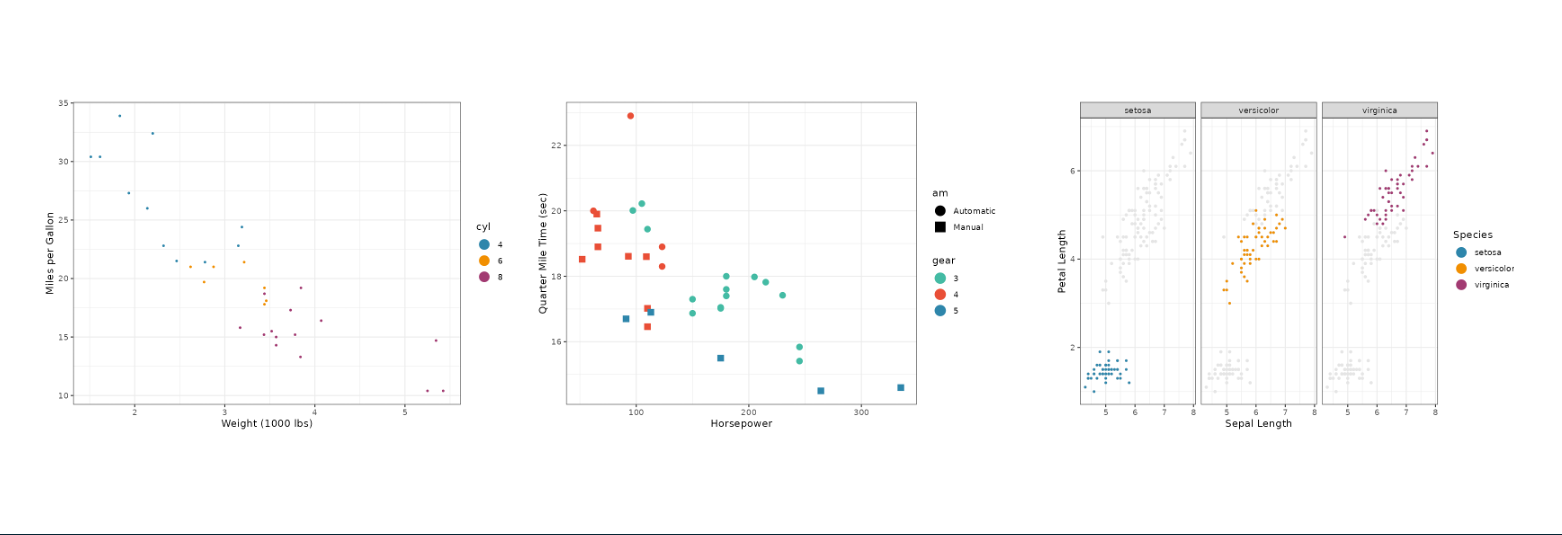
dittoVizdittoViz_scatterPlot - x/y coordinate plots with
additional color and shape encodings (wraps
dittoViz::scatterPlot). Supports overlaying fit lines,
including multiple custom model lines defined
interactively: add a row per model, each with its own R model formula
(e.g. revenue ~ poly(units, 2)), fitting function
(lm, glm, loess, or a registered
backend), line colour, and width, see vignette("custom-model-lines", package = "VizModules").dittoViz_yPlot - Multi-variate Y-axis plots (boxplot,
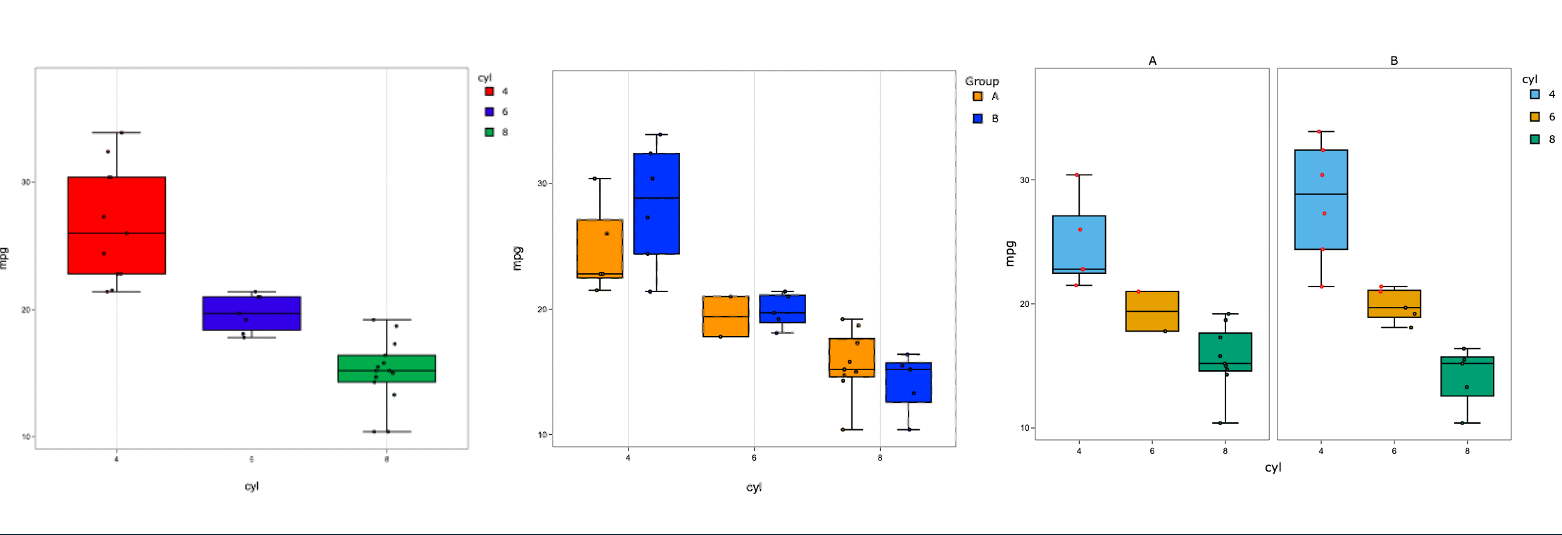
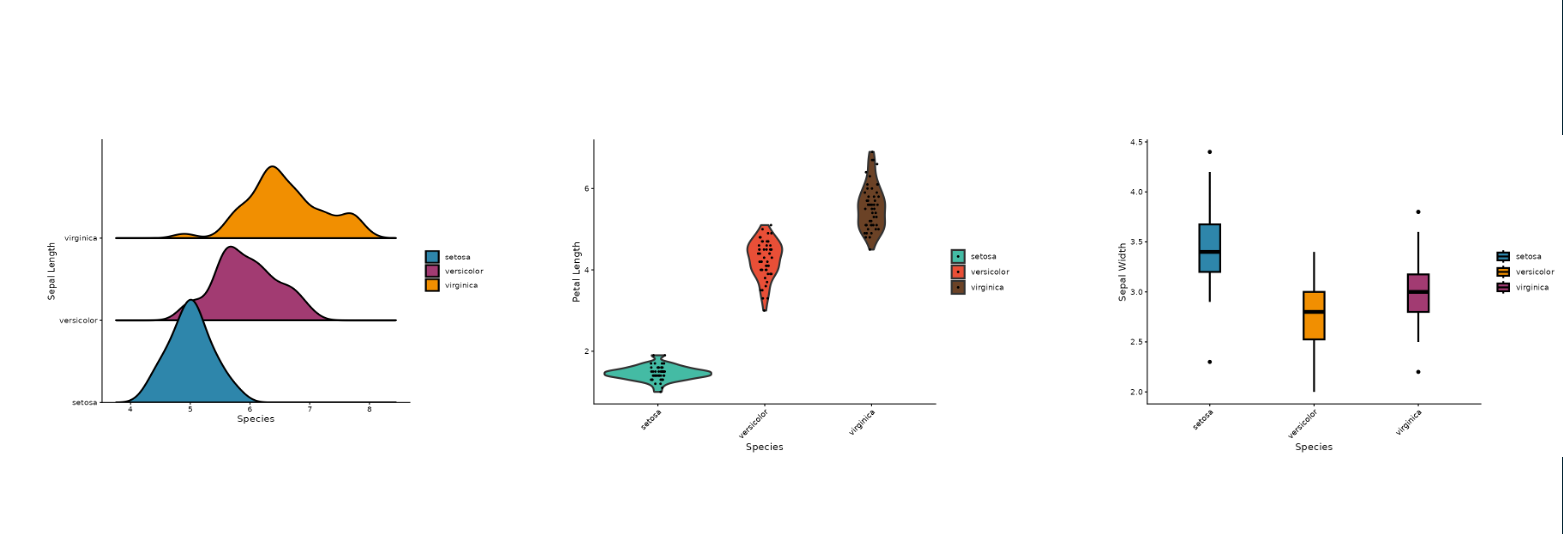
jitter, violinplots - wraps dittoViz::yPlot).dittoViz_freqPlot - Box/jitter plots for discrete
observation frequencies per sample/group (wraps
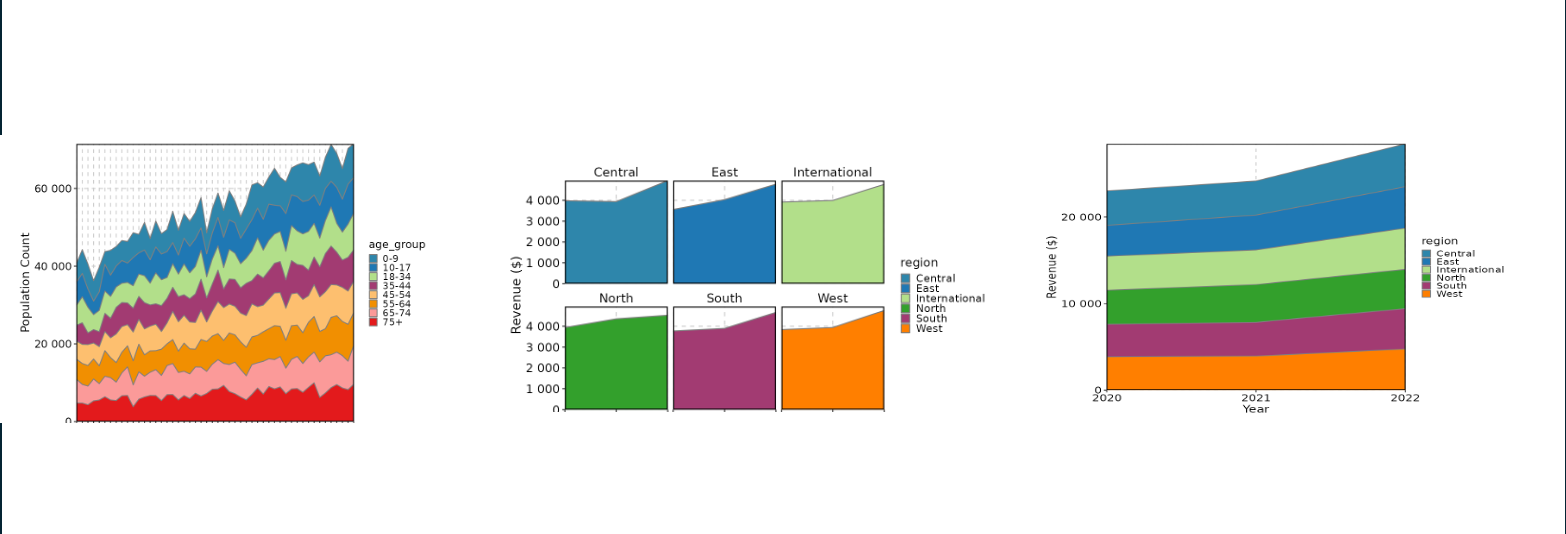
dittoViz::freqPlot).plotthisplotthis_AreaPlot - Stacked area charts (wraps
plotthis::AreaPlot).plotthis_BoxPlot - Box plots (wraps
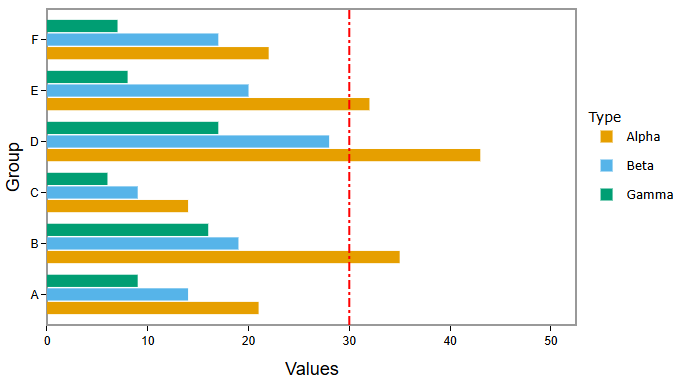
plotthis::BoxPlot).plotthis_BarPlot - Bar charts (wraps
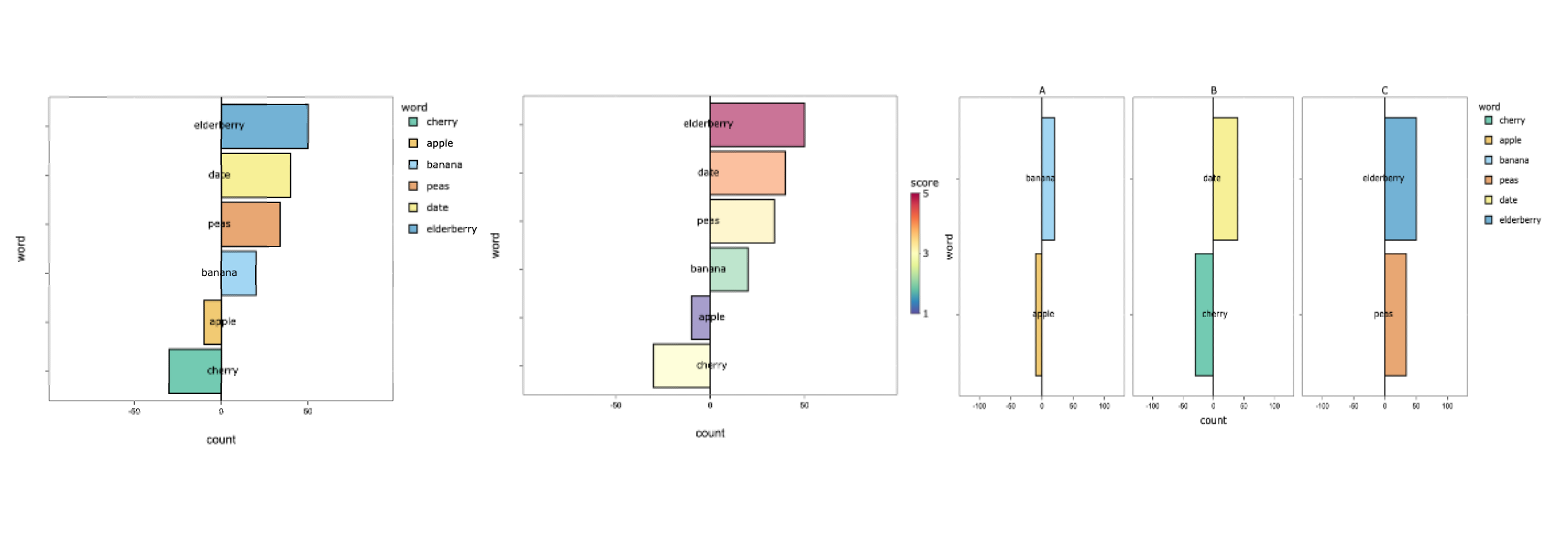
plotthis::BarPlot).plotthis_SplitBarPlot - Split bar charts (wraps
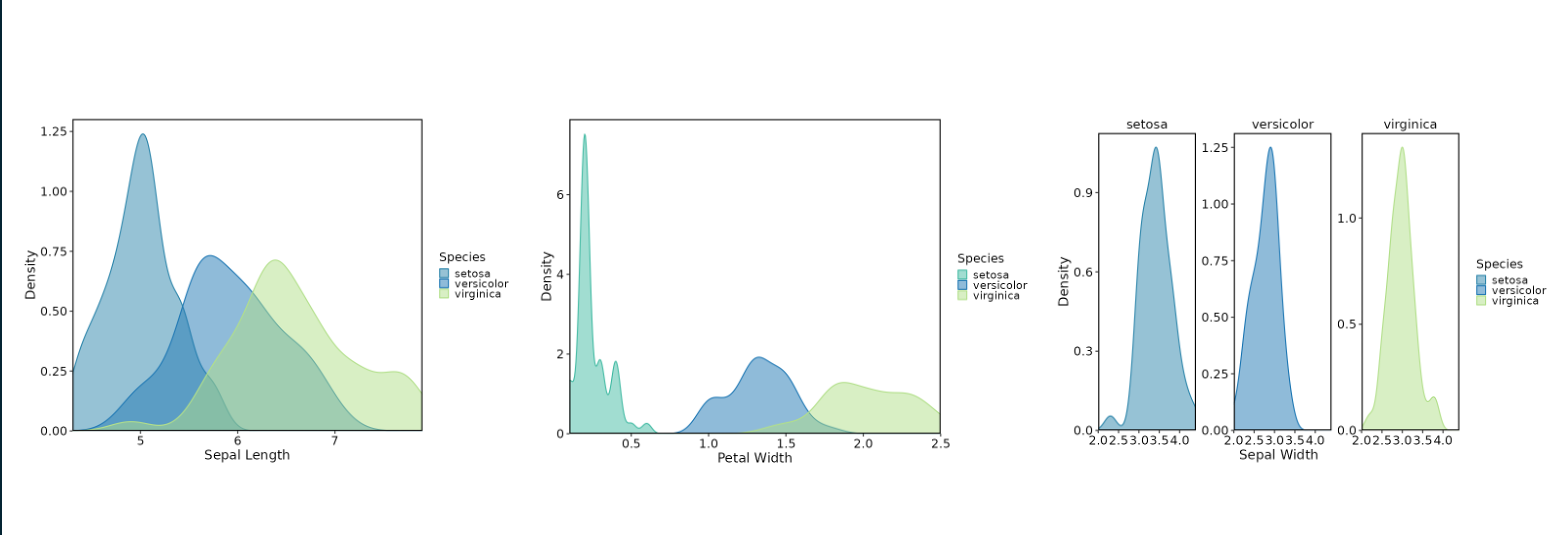
plotthis::SplitBarPlot).plotthis_DensityPlot - Density plots (wraps
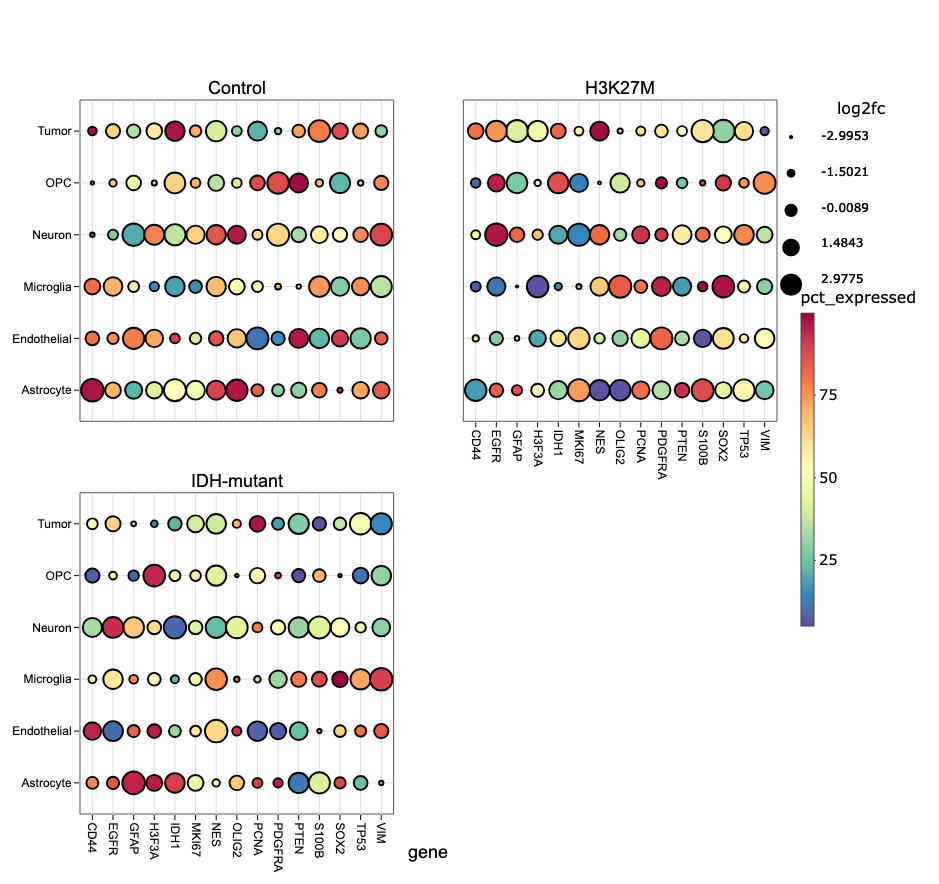
plotthis::DensityPlot).plotthis_DotPlot - Dot plots (wraps
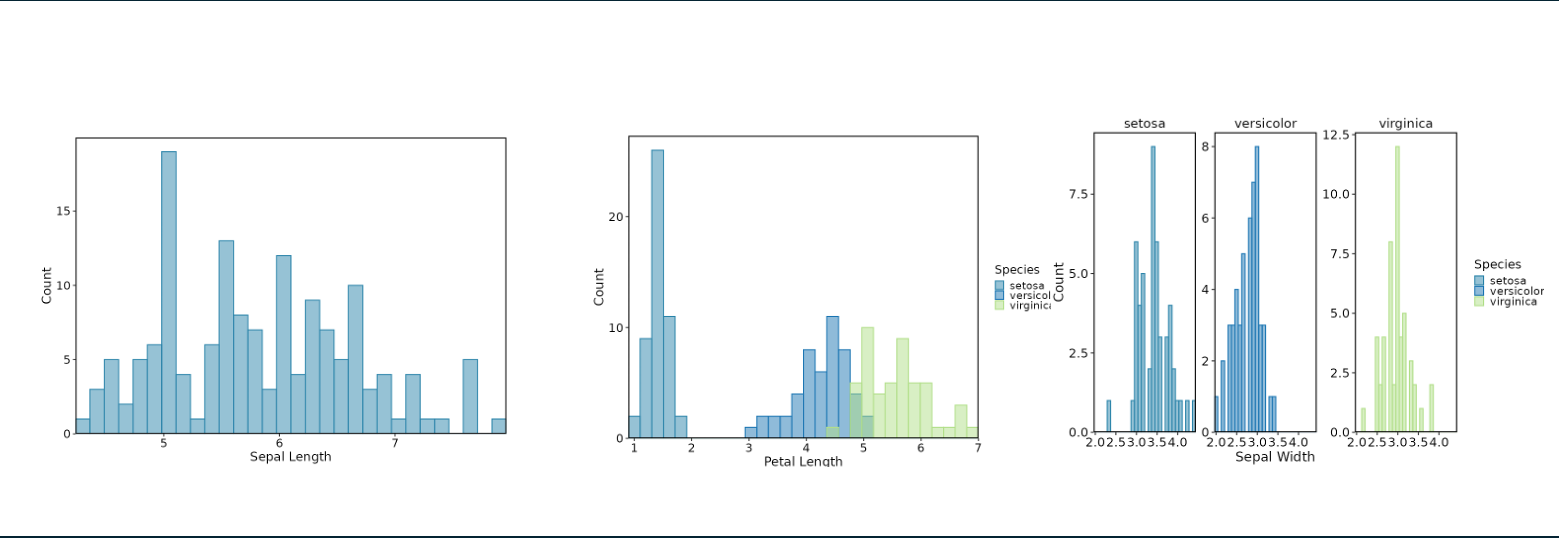
plotthis::DotPlot).plotthis_Histogram - Histograms (wraps
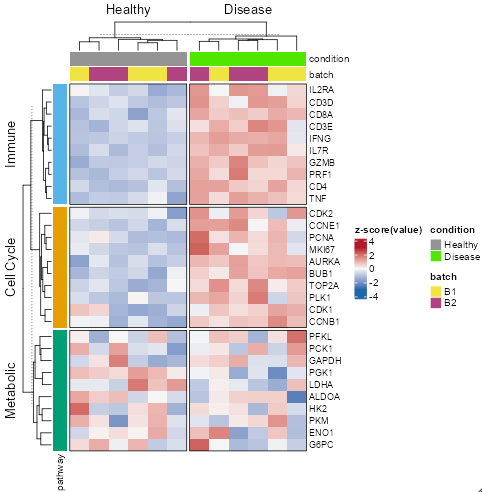
plotthis::Histogram).ComplexHeatmapComplexHeatmap_Heatmap - Interactive heatmaps with
row/column annotation tracks, clustering, and sub-heatmap zoom (wraps
ComplexHeatmap::Heatmap). This is the one module whose
output is not plotly - it renders through InteractiveComplexHeatmap,
so the plotly-specific controls (the Plotly tab, download formats,
draggable annotations) do not apply. It is also the one module whose
data may be a list rather than a data frame: pass
data = list(matrix = <data.frame>, column_annotations = <data.frame>)
when you want column annotation tracks, where the companion table
carries one row per sample column. ComplexHeatmap,
InteractiveComplexHeatmap, and circlize are
Suggests rather than hard dependencies, so install them
with
BiocManager::install(c("ComplexHeatmap", "InteractiveComplexHeatmap", "circlize"))
before using this module.
ComplexHeatmap_HeatmapMainOutputUI(),
ComplexHeatmap_HeatmapSubOutputUI(), and
ComplexHeatmap_HeatmapInfoOutputUI() if you want the main
heatmap, the sub-heatmap, and the click/brush info panel in separate
places in your layout.Via direct implementation with plotly.
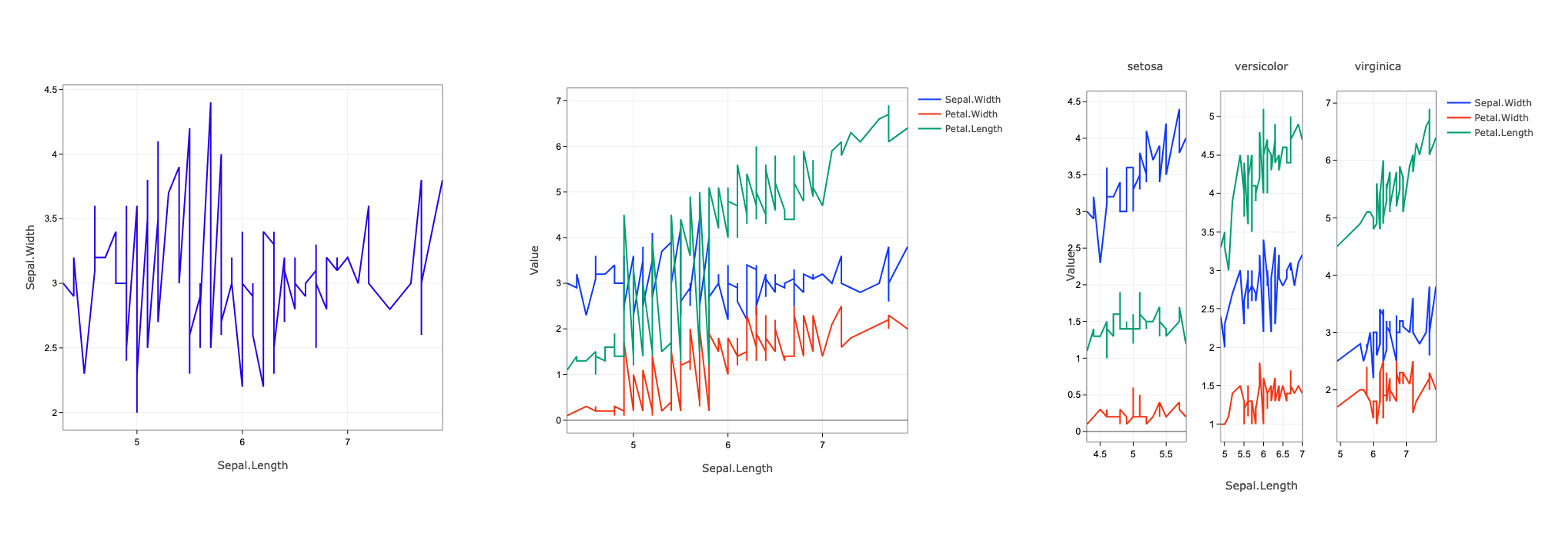
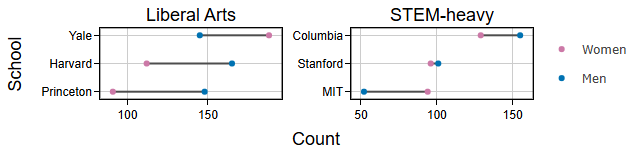
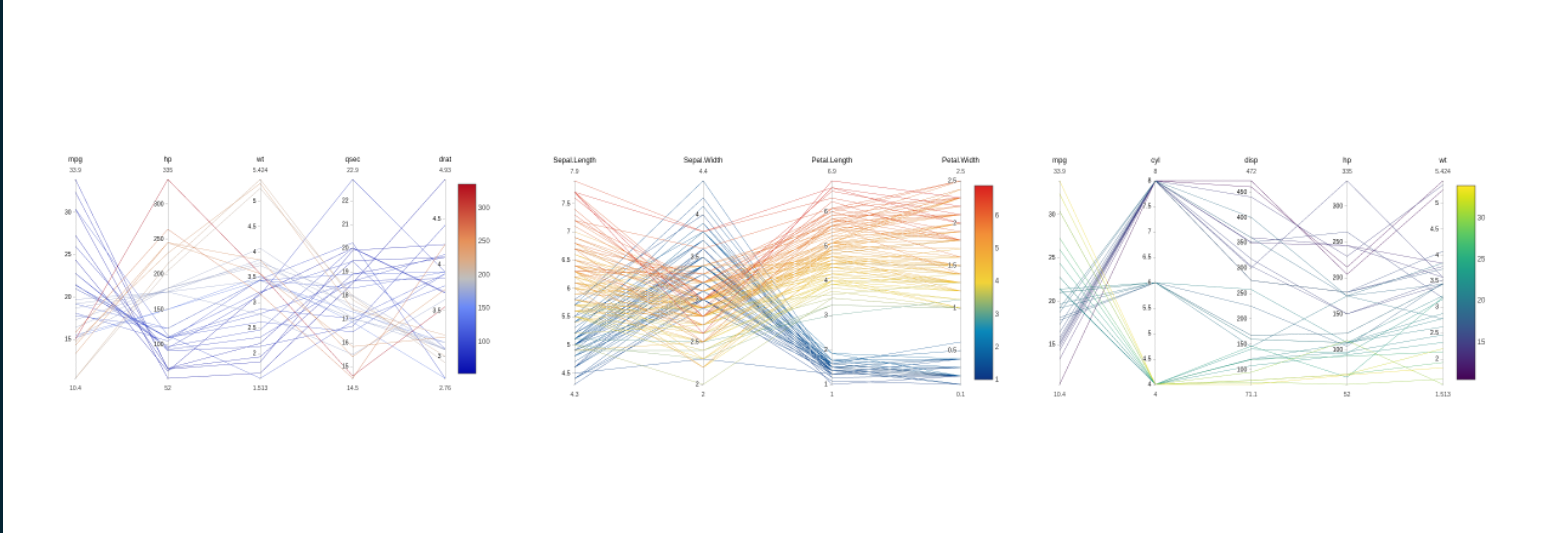
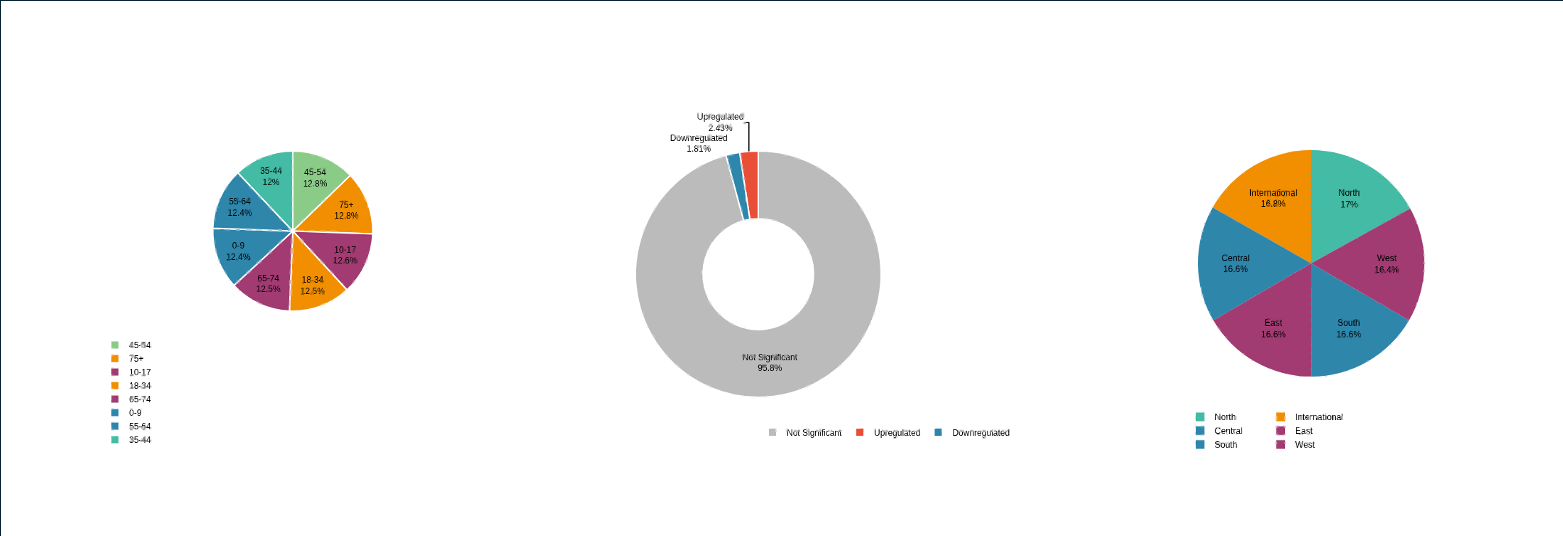
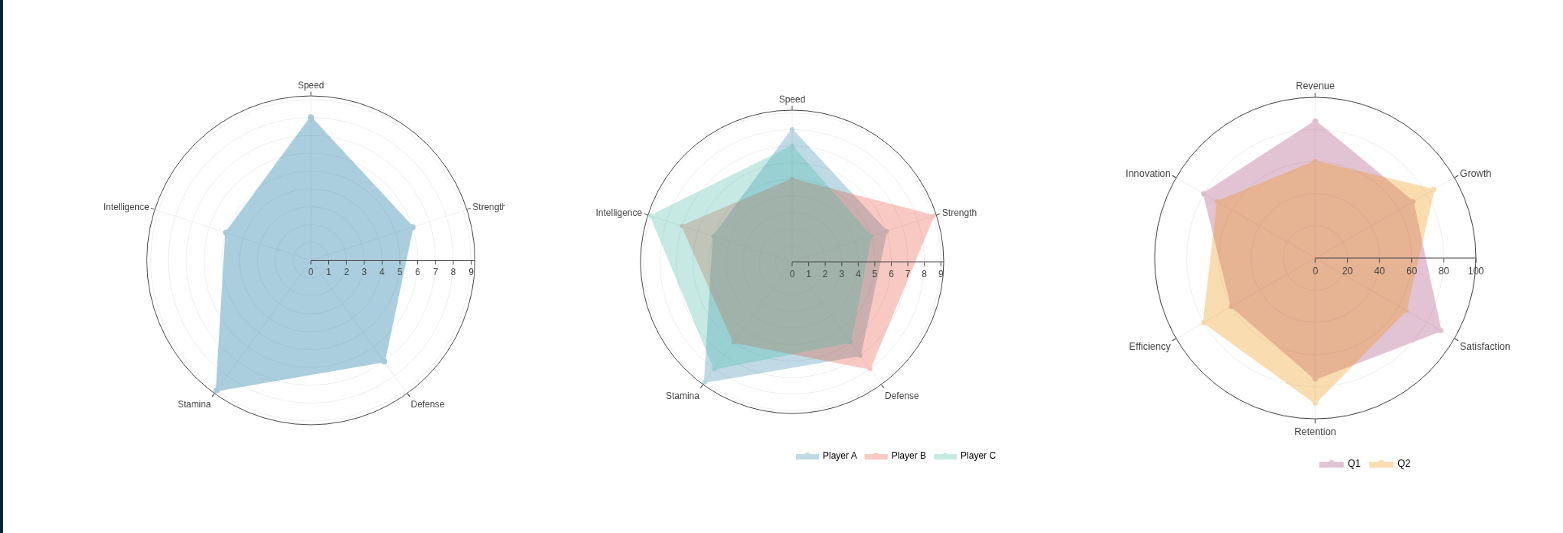
linePlot - Line plotspiePlot - Pie and donut plotsradarPlot - Radar plotsparallelCoordinatesPlot - Parallel coordinate
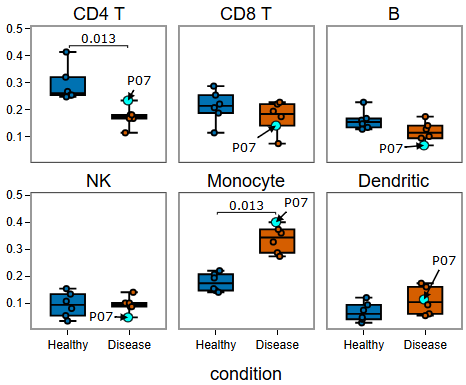
plotsdumbbellPlot - Dumbbell plotsThe BoxPlot, yPlot, and
freqPlot modules include a Stats tab
that adds pairwise statistical testing with bracket annotations directly
on the plotly figure. On freqPlot the tests are always
run within each facet (the stat.per.facet control is
hidden), since each facet is a different level of the frequency variable
and pooling across them would compare non-comparable quantities. The
underlying helpers (compute_pairwise_stats(),
create_stat_annotations(),
apply_stat_annotations(),
generate_pair_strings(), parse_pair_strings())
are exported so you can add the same bracket annotations to any custom
plotly figure. See vignette("statistical-testing", package = "VizModules").
collect_source_data() collects the interactive plot as
HTML, its plot data, pairwise testing statistics (if applied), and UI
input values into a single list, and
create_source_download_handler() turns that into a compact
zip folder of summary data for the output plot. The zip also carries an
SVG and a PNG of each plot, captured in the browser so they match what
is on screen — every reference line, statistical bracket, and dragged
annotation included. create_source_download_handler() also
accepts a named list of summaries (one per plot), which is how the
Figure Builder bundles every plot on the canvas into one download.
*, **, ***,
****)p.adjust method (Holm,
Bonferroni, BH, etc.)group.by levels within each
x-axis categoryWhen using paired tests (Wilcoxon signed-rank or paired t-test), each group must have the same number of observations in corresponding order. Data should be sorted so that paired samples align row-by-row within each group.
dittoVizdittoViz is under active development, so additional modules may be added as more visualization functions are added.
To contribute a new module to the package, see the vignette for clear
guidelines: vignette("adding-a-new-module", package = "VizModules")
The developers made use of AI tools (e.g. GitHub Copilot, Claude Code) for code generation, documentation writing, and test creation. AI assistance was used to accelerate development after the initial module scaffolding and structure was in place, but all AI-generated content was reviewed and edited by human eyeballs/hands to ensure accuracy and quality. Our own hands are all over this project, and we are invested in it. Any inaccuracies, bugs, or issues are attributable to us, and we welcome contributions to help improve the package.
Generative AI tools (GitHub Copilot, ChatGPT, Claude, Gemini, Cursor, etc.) are explicitly welcome for building Shiny apps with these modules in addition to creating new modules. To do so, we recommend the use of the skills provided by the package detailed below.
The package provides three Agent Skills that give an agent the package’s conventions without it having to read the vignettes first. Install them into a project with:
VizModules::use_vizmodules_skills(".")That writes vizmodules-app,
vizmodules-custom-module, and
vizmodules-new-module into .agents/skills/ by
default, where GitHub Copilot and OpenAI Codex discover them
automatically. Pass client = "copilot" for
.github/skills/ (also read by GitHub Copilot) or
client = "claude" for .claude/skills/ (Claude
Code); call the function more than once with different
client values to install into several locations at once.
vizmodules-app in particular carries a generated inventory
of every module’s column-mapping keys (x.data vs
x.by vs x.value vs var), colour
key, tab names, and stats keys, which is what an agent otherwise spends
its budget grepping for.
In rough benchmarking, vizmodules-app saves ~40-60% of
token usage versus just chucking an agent at the docs/repo/prompt below
and generates a functional app in about half the time. The other skills
show more variable and modest savings (~10-20% fewer tokens), but they
tend to avoid common pitfalls and better utilize some of the more
advanced features. Skills are difficult to benchmark, as the benefits
are context-dependent and vary with the request.