Generate Venn diagrams from two or three sets, displaying the overlapping items as lists in the appropriate sections. The lists can be split into columns or shortened for large sets and the plot is generated using ‘ggplot2’ allowing further customisations.
You can install the development version of VennItem from GitHub with:
# install.packages("pak")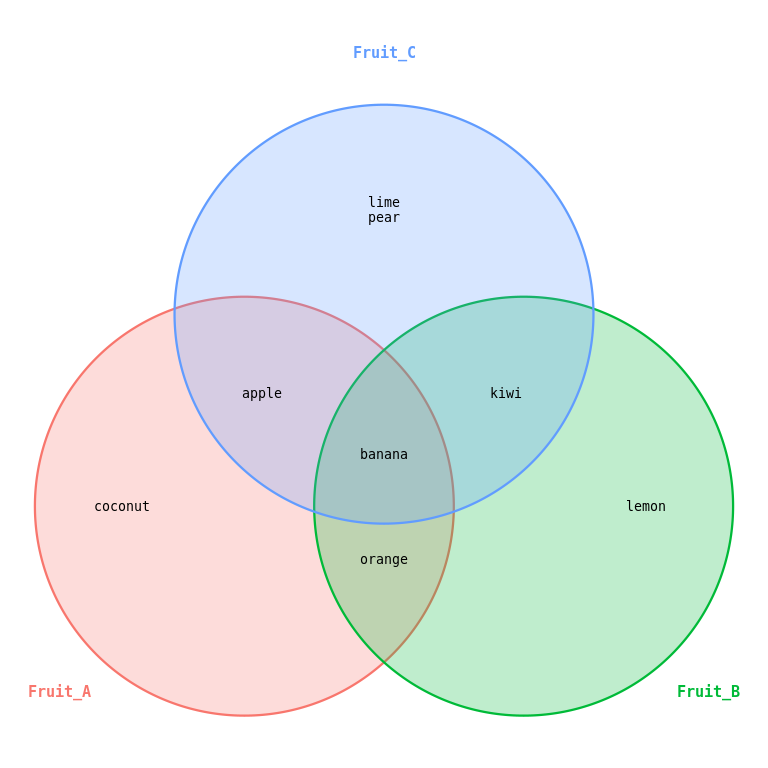
pak::pak("microbialman/VennItem")Basic example showing two small sets.
library(VennItem)
sets <- list(Fruit_A = c("apple","banana","coconut","orange"), Fruit_B = c("banana","kiwi","lemon","orange"), Fruit_C = c("banana","kiwi","apple","pear","lime"))
vennItem(sets, set_label_size = 4)
Example of larger sets showing column formatting ability.
big_sets <- list(Fruit_A = c("apple","banana","durian","lychee","grapes","pear","melon"),
 Fruit_B = c("banana","kiwi","satsuma","orange","lemon","lime"),
 Fruit_C = c("banana","kiwi","apple","pear","coconut"))

vennItem(big_sets, ncol_items = 2)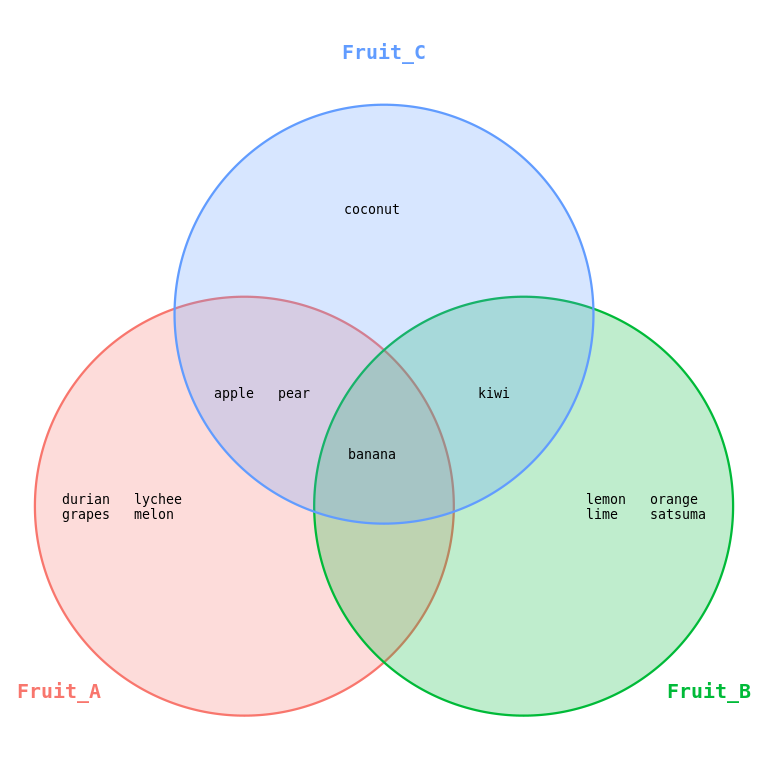
Example of larger sets showing shortening.
big_sets <- list(Fruit_A = c("apple","banana","durian","lychee","grapes","pear","melon"),
 Fruit_B = c("banana","kiwi","satsuma","orange","lemon","lime"),
 Fruit_C = c("banana","kiwi","apple","pear","coconut"))

vennItem(big_sets, max_items_per_region = 2)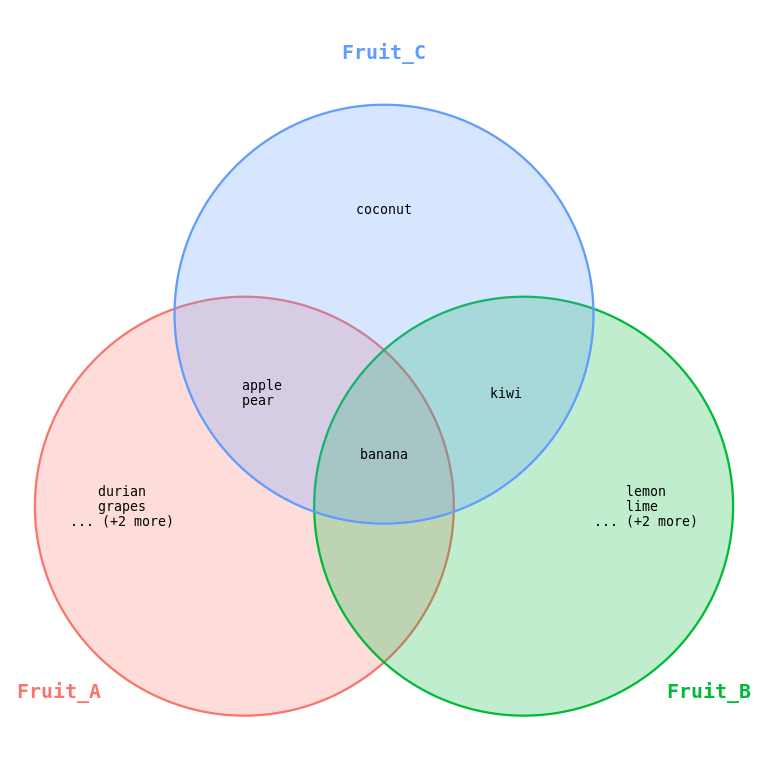
Example showing basic numbering of set size.
sets <- list(Fruit_A = c("apple","banana","coconut","orange"), Fruit_B = c("banana","kiwi","lemon","orange"), Fruit_C = c("banana","kiwi","apple","pear","lime"))
vennItem(sets, max_items_per_region = 0)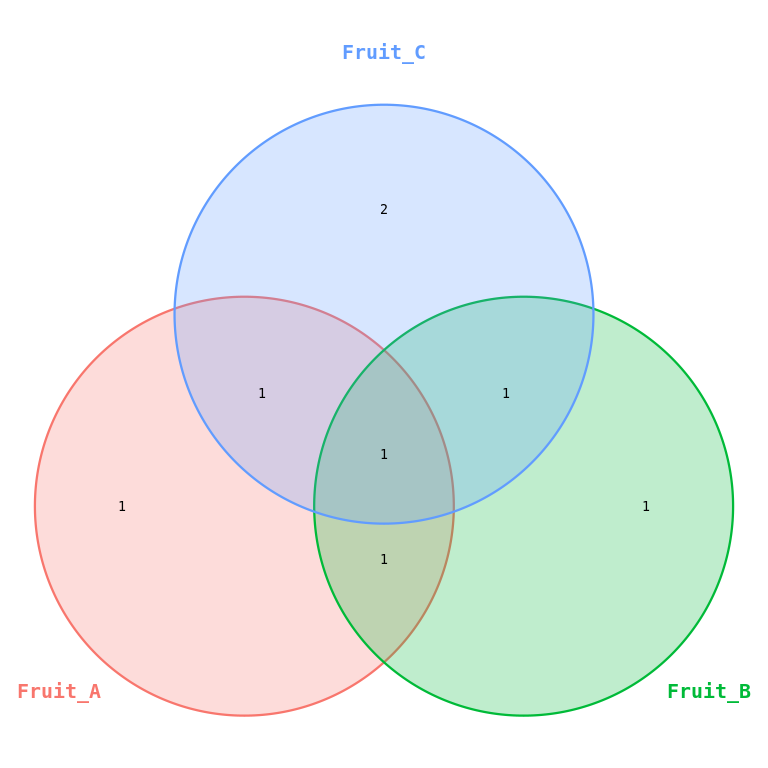
Need a high-speed mirror for your open-source project?
Contact our mirror admin team at info@clientvps.com.
This archive is provided as a free public service to the community.
Proudly supported by infrastructure from VPSPulse , RxServers , BuyNumber , UnitVPS , OffshoreName and secure payment technology by ArionPay.